The Morningstar Star system is, by far, the most popular way for individual investors to assess a mutual fund or exchange traded fund (ETF).
While the system is fairly straightforward in theory, it can lead to odd, and often confusing results. As always, it pays to understand how the system works to understand what the stars are telling you.
The case in point is the Vanguard Total Bond Market funds and its various share classes that tracks the Barclays Aggregate Bond index.
Some of the share classes differ due to the expense ratio: larger volumes get lower prices, just like at Costco or Sam’s warehouse. Vanguard is unique, though, in that one of the share classes is an ETF; it’s a patented structure.
Morningstar has multiple star-systems as well – one for stocks, one for mutual funds and one for ETFs.
So, when you look at one of the Vanguard Total Bond Market mutual funds, you see that it has three stars and when you look at the Vanguard Total Bond Market ETF, which are simply different wrappers on the same portfolio, it only has two stars.
The heart of the Morningstar star system is a simple category comparison.
The Morningstar team looks at other funds that they think are similar, puts them all in one category and then rank each fund within the category.
The top 10 percent of funds, based on a combination of past performance and realized volatility, get five stars, the next 22.5 percent get four stars, the middle 35 percent earn three stars, the next 22.5 percent get two stars and the bottom 10 percent get one star. (See the complete rule book here.)
To be in the intermediate term bond category, you simply need to have a duration that is between five and 10 years. Your corporate bond exposure (the risk of default), however, can be all over the board (unless it’s no corporate bond exposure, which means that you fall into the intermediate Treasury bond category).
The Barclays Aggregate, and therefore, the Vanguard Total Bond fund, has about 25 percent of the portfolio invested in bonds with corporate bond exposure and the intermediate term bond fund category as determined by Morningstar, has about 41.5 percent corporate bond exposure.
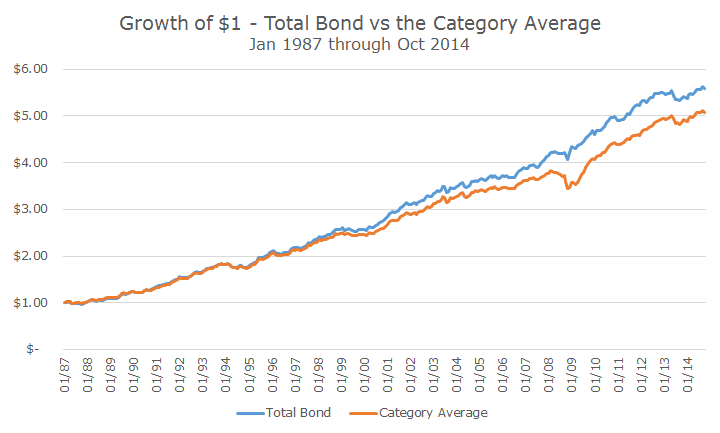
Over the long-run, the Vanguard bond fund has strongly outperformed its category, especially in 2008 when corporate bonds fell sharply, as seen in the chart below.
The problem is that the Morningstar star system only looks back a few years and it’s difficult to tell what look back period they use for each fund. For example, for the Vanguard Total Bond mutual fund, the three star status is based on a weighted average of three, five and ten year ratings; 20, 30 and 50 percent respectively.
The ETF rating, since the ETF is newer, gets its average star rating from the three and five year weighting, 60 and 40 percent respectively.
Making matters even more confusing is that there are separate pools of funds for comparison. The mutual fund is compared to 800 other intermediate term bond funds. Since the ETF doesn’t have very many competitors, there are only eight funds in the category, which means that it can swing around a lot more.
I suppose the point is that to really get much out of the star rating, you really have to know what it’s telling you. It’s no surprise to me that a fund tracking the Barclays Aggregate is underperforming the group because corporate bonds are on a spectacular run and the peers are overweight in this exposure.
While it’s been working recently, that same strategy crushed the category during 2008 when the category fell -4.70 percent and the Aggregate gained 5.05 percent.
Especially after 2008, we think that the bond allocation represents the safe side of the house and shouldn’t be invested aggressively. In a crisis, we don’t want the low risk assets to perform poorly, we want them to serve as a ballast and stabilize the portfolio.
In between crisis, we still want attractive returns though, and the Aggregate has done well in absolute terms, even if it hasn’t kept up with the peer group, gaining 4.22 percent over the five years ending October 31, 2014.
I’ve said before that I have a love-hate relationship with Morningstar. I love the data and some of the commentary, but the star-system oversimplifies complex information that promotes short term investing and performance chasing. Buyer beware.