Thankfully, Greece has been out of the headlines for a few weeks as the Mediterranean country continues to negotiate their third bailout in five years.
In the meantime, some of the capital controls are beginning to lift: banks reopened on July 20 (although withdrawals are still severely limited) and yesterday, the Greek stock market opened again, albeit -16 percent lower.
Obviously, that’s an enormous decline – the S&P 500 has only had one day that was worse, back on Black Monday in 1987. The second worse day was in 2008, when the S&P 500 fell by -9.03 percent.
Interestingly, though, the only Greek exchange traded fund (ETF) that I am aware of only fell by -2.66 percent yesterday. What gives?
It turns out that the ETF already took the hit because it was open for trading for the last few weeks while the stock market wasn’t. The ETF fell by -19.44 percent back on June 29, when the capital controls that closed the banks and the market were first put in place.
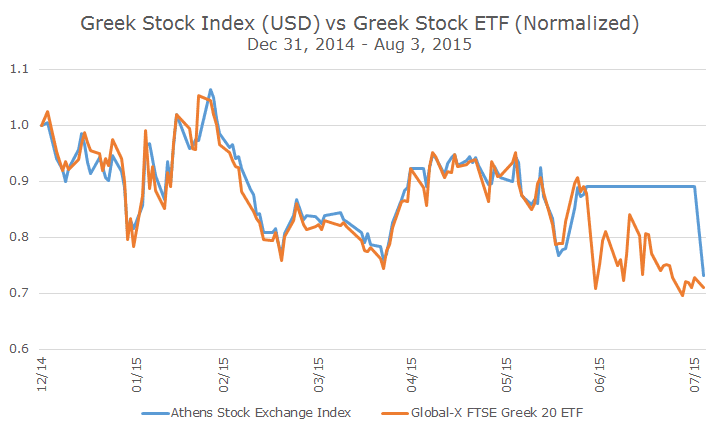
While the actual Greek stock market was closed, the Greek ETF still changed hands throughout the entire period. Here’s a chart that compares the Athens Stock Exchange Composite Index in US dollar terms and the Global X FTSE Greece 20 ETF.
To me, this chart tells a great story of price discovery, the process of setting prices between buyers and sellers. Even though the Greek stock exchange was closed and, therefore, Greek stocks weren’t trading, investors in the US were still able to put prices on all of them when they traded the ETF.
When the market actually reopened and the index could be calculated, prices settled at levels very close to what the ETF would have suggested. It isn’t perfect, but it’s pretty close.
This also helps tell the story that I described last week where the prices on index funds can actually tell a more accurate story about price and value than the indexes can due to the different time zones that span the globe. Read the entire article here.
This is a little different because the index was closed for a long time, but it does signal that ETF prices do have valuable information.
Just before the 2008 financial crisis, we had been looking at bond ETFs. That was tabled during the crisis (we were fairly busy as you might imagine), but we noticed that there was a big disconnect between ETF prices and the net asset value of the portfolio, which is known to investors.
For example, one ETF that we looked at had a net asset value that was equal to $91.87 per share when Lehman Brothers went bankrupt. The price of the ETF in the market was $81.79, which in theory meant that you could buy the portfolio of bonds for 89 cents on the dollar – a big deal in any market, but especially the bond market.
At the time, we didn’t know enough about ETF mechanics and were worried that the net asset value wasn’t right and would converge to the lower price. In fact, the price was the better signal, which makes sense because the ETFs were a lot more liquid than the bonds that create the index.
I know this sounds like ‘which came first, the chicken or the egg’ because prices create indexes that set prices (circular, I know). It’s important, though, because you can see in these examples that the prices are right, which is a signal for market efficiency (the idea that prices reflect all available information).
People that are opposed to market efficiency would point to the 16 percent one-day decline in the Greek stock market. They would say that you would only expect an outcome like that every million years (or something) based on a normal distribution.
That’s 100 percent true, but funnily enough, there is nothing in the Efficient Market Hypothesis that says that stock prices follow a normal distribution. In fact, half of Gene Fama’s distribution was about how market returns don’t follow a normal distribution curve.
It’s true that modern portfolio theory does rely on a normal distribution curve as a proxy for risk, but every efficient market person I know is crystal clear about saying that it’s only a proxy and that outlier events are more common than a normal distribution would imply.
It’s funny how two people with opposite world views can look at the same set of facts and walk away with even more conviction than they had before. I’m obviously on the side of efficient markets – they aren’t perfectly efficient, but they’re close enough that investors should act as if they are anyway.


