I was emailing a friend who works in the industry on Friday about asset classes that are giving us trouble this year. We both have diversified portfolios for our clients and when you’re truly diversified, something is always giving you a headache.
For us, for example, micro cap stocks as measured by the Russell Microcap index are a real aggravation this year, down -1.85 percent this year through Friday compared to the S&P 500, which is up 13.1 percent over the same time period.
He mentioned commodities and I must have been feeling a little bit like a jerk because at the end of one of my replies, I wrote, ‘PS – commodities suck.’
Unpleasant as it may be, it’s a true statement, especially this year, since the S&P GSCI commodity index is down -16.15 percent. I won’t quote him directly, but he was equally gracious in his reply and added that they will have their day in the sun.
Admittedly, commodities have enjoyed periods of strong returns. This particular commodities index is oil-heavy, so it did very well in the late 1970s (which spawned the creation of the index), again in the late 1980s and, most recently, leading up to the financial crisis.
The best 12-month period for this index was started in July 2007 and ended in June 2008, when it climbed 75.98 percent, which was especially nice since stocks were falling at that point.
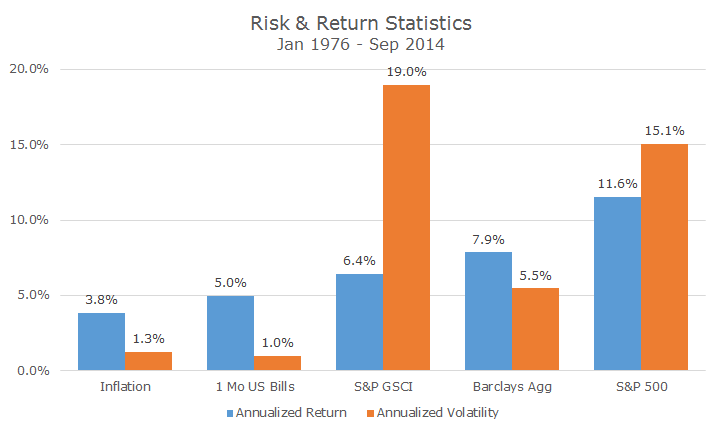
The longer-term record, however, is not encouraging in my mind. The S&P GSCI was the first commodities index designed to be traded and has one of the longest track records. The chart below shows the realized returns and volatility since the inception of that index.
The left most column in blue shows that, over this period, inflation has been 3.8 percent. One-month US Treasury bills, our proxy for cash and the risk free rate, did somewhat better at 5.0 percent (making the case for Treasury bills as a good inflation hedge, despite the current zero interest rate policy).
Commodities did a little better than cash at 6.4 percent, but not by an enormous amount, especially when compared to the bond market or the S&P 500 during this period, which earned 7.9 and 11.6 percent respectively.
Like all reviews of past performance, there are some grains of salt to be taken here, especially if we want to make some assumptions about future returns based on past returns (always a dangerous exercise).
First, cash returns will be lower for a long time, given current Federal Reserve Policy. Second, bond returns will also be lower since interest rates fell during the period in the chart and they can’t repeat that. Finally, this particular period was better than the long-term average for stocks. So, caveat emptor.
Given those caveats, it may be that the volatility data is more interesting than the return data. Notice how, with the exception of commodities, volatility increases as returns increase. The realized volatility for commodities, though, is more than 25 percent higher than it is for stocks, despite having materially lower returns.
For someone who believes that risk and return go hand in hand, commodities are making my brain say, ‘does not compute.’
Thinking about the risk and return together (caveats above), I decided to do a statistical test to see whether the excess return for commodities was statistically significant. Yes, there was an excess return of 1.46 percent for this period, but it’s so volatile that you might just be looking at fluke in the data.
I did the test for stocks, bonds and commodities and could be 99.9 percent confident that bonds earned a premium over cash, 99.7 percent confident that stocks earned a premium over cash, but can only be 70.5 percent confident in the premium for commodities. That’s far better than a coin toss, but it doesn’t compare to stocks and bonds.
People who buy commodities say that they do it because the correlation between commodities, stocks and bonds is low, which is absolutely true. Against stocks, the correlation for commodities is 0.17 and against bonds, it’s -0.02.
The trouble for me is that the risk and return characteristics are so lousy (stock-like volatility for bond-like returns) that it doesn’t matter to the whole portfolio.
To test this, I created a 60/40 stock/bond portfolio and a 55/35/10 stock/bond/commodity portfolio using the indexes above. In the end, the portfolio returns and portfolio volatility for both portfolios were basically identical – the risk and return differences were immaterial.
To top it all off, investing in commodities is difficult and introduces a whole host of other complications from tax reporting to unintended credit risk.
In short, we’re happy leaving commodities to the other guys.


