Yesterday, I discussed corporate bonds, and how their yield tells us something about investor risk appetite. You can read the article here.
The same thing applies to non-investment grade bonds, which are also called ‘high yield,’ or less pleasantly, ‘junk bonds.’
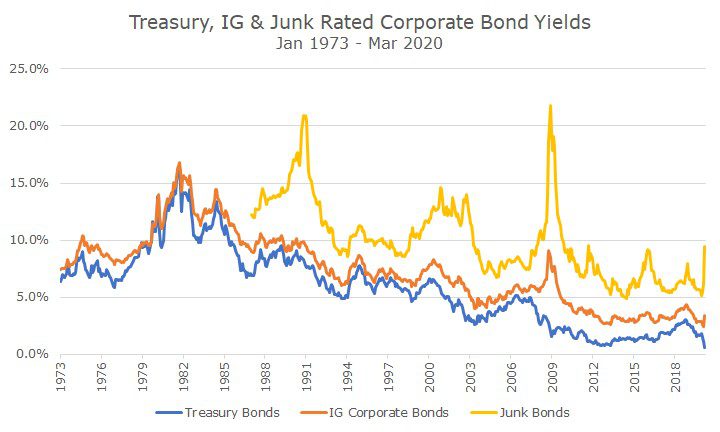
The first chart below is exactly like the first chart in yesterday’s article, but also includes the yield on junk bonds (in yellow) in addition to Treasury bonds (in blue) and investment grade corporate bonds (in orange).
And, like yesterday, I’m going to strip out the level of interest rates to focus on the difference, or spread between the various types of bonds.
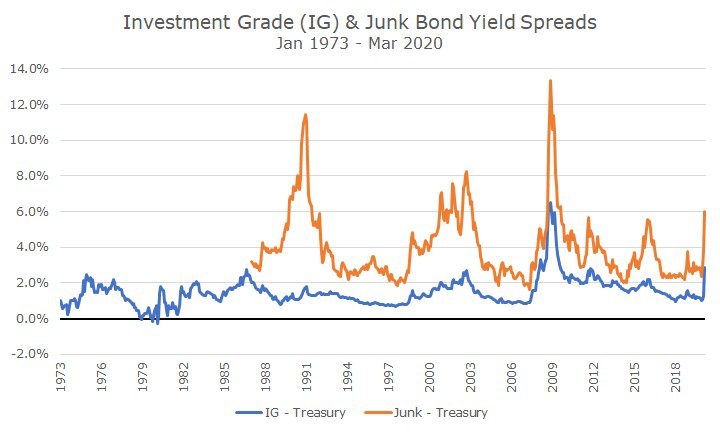
I didn’t coordinate the colors very well, because in this chart, I’m showing the investment grade spread in blue and the junk bond spread in orange.
Despite my inconsistent coloring, you can see that the junk bond spread looks a lot like the corporate bond spread, but even more so. There are several periods of stress, including the recession in the early 1990s, the recession in the early 2000s and the 2008 financial crisis.
Yesterday, I concluded by saying that since the yield spread had blown out, or widened, it may be time to overweight our exposure to investment grade corporate bonds (no decisions as of yet, that will be a long, deliberative process).
If junk bonds have higher returns than investment grade bonds, which they do by 1.7 percent per year since 1971, why not consider them in the same way that we are with investment grade bonds. The yields have blown out even more, which should make them even more attractive, right?
Maybe for some investors, but not for us. We don’t have a moral objection to junk bonds, our reasoning is twofold.
First, junk bonds are a lot riskier than Treasury bonds or corporate bonds. In fact, junk bonds are almost twice as volatile as Treasury bonds.
Second, and this is the more important issue for us, junk bonds are highly correlated with stocks. That’s a fancy way of saying that you don’t get as much diversification benefit with junk bonds than you do with Treasury bonds.
To understand this, let’s look at some scatter-plots. The first chart compares each monthly return of the stock market on the left and the Treasury bond market on the bottom.
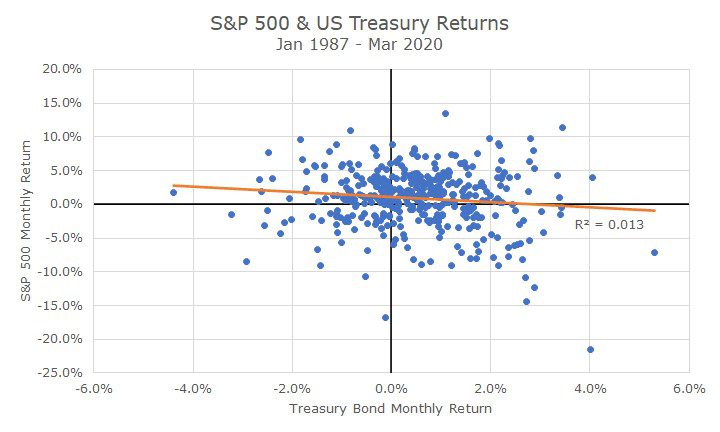
If you’re using just your eyeballs, you can see that the dots are somewhat evenly scattered between and across the four segments of the chart.
The orange line shows the formal method of calculating the relationship, and you can see that it’s fairly close to flat. It has a small downward slope to it, which means that there is a slight negative correlation, but it’s so slight that you’d look at it and say that there’s almost no correlation.
If you’re not accustomed to looking at scatter-plots, it will be more obvious when you look at the S&P 500 returns compared to junk bonds returns.
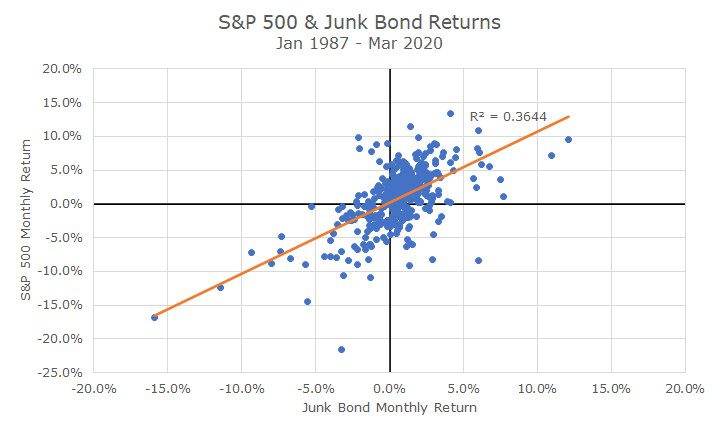
In this case, you can see that when stocks are down, so are junk bonds. When stocks are up, so are junk bonds. The relationship is highly correlated.
In the real world (and not some scatter-plot), that means you’re losing money on your bond portfolio at the same time that you’re losing money on your stock portfolio.
In the Treasury bond chart above, you can see that when stocks are losing, Treasury bonds may be winning or losing (a little more winning than losing, but not much).
We’ve ruled out junk bonds because of their strong correlation to stocks. If you’re going to take stock market risk, why not just own stocks?
And, we don’t own just Treasury or investment grade bonds, we own a mixture. The Aggregate bond index doesn’t match our portfolio, but I’m going to show it anyway because it has a mix of corporate and Treasury, which illustrates the idea that you can pick up some yield but still have the low correlation with stocks.
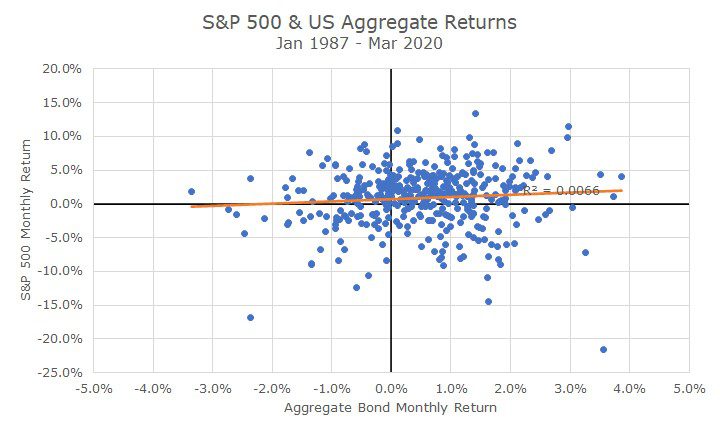
That scatter-plot looks a lot like the Treasury scatter-plot, but the Aggregate has outperformed Treasury bonds by 0.25 percent per year since 1971.
And, just as importantly as the higher return (albeit slight), but the volatility is lower, demonstrating that different assets combined together reduce overall risk.
After all, we should always seek portfolios with higher expected returns, lower expected volatility that diversifies our holdings.

David is a trusted advisor to 50 families, delivering comprehensive financial solutions, including financial planning, investment management, cash management, tax planning, estate planning, and charitable giving. As Chief Investment Officer, he leads the Investment Committee and the research and trading team. His team continuously evaluates investment strategies and securities, working closely with Portfolio Managers to implement them effectively.