If you were watching CNBC or Bloomberg television yesterday, you saw that the ‘big news’ of the day was that the NASDAQ market crossed 5,000 for the first time since the peak of the tech bubble.
Although the financial news media loves to celebrate when indexes cross round numbers (think 2,000 for the S&P 500 or 18,000 for the Dow Jones Industrial Average), they don’t do a whole lot for me personally.
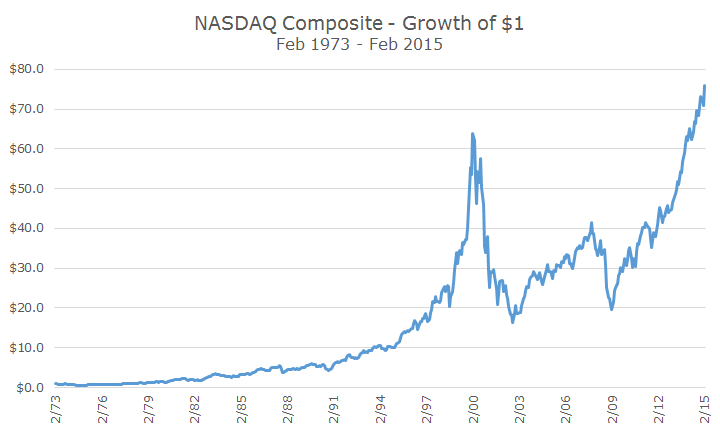
The NASDAQ story is interesting, though, not because of the round number, but because the current level brings the index nearly back to its all-time closing high of 5,048 on March 10, 2000. We’re still about a percent away from crossing that threshold and while nothing is a foregone conclusion, it seems likely that we’ll get there in relatively short order.
When the tech bubble burst, the NASDAQ was the hardest hit index because it had a very large weight to technology stocks. At the peak, technology stocks were 65 percent of the index. The weight has come down to 43 percent, but that’s still more than double the weight of technology stocks in the S&P 500.
From the peak to the trough, March 10, 2000 through October 9, 2002, the NASDAQ index fell 77.9 percent – a staggering decline. That’s not quite as bad as the losses during the Great Depression when stocks fell almost 90 percent, but it’s one of the worst drops that I’ve seen in my lifetime.
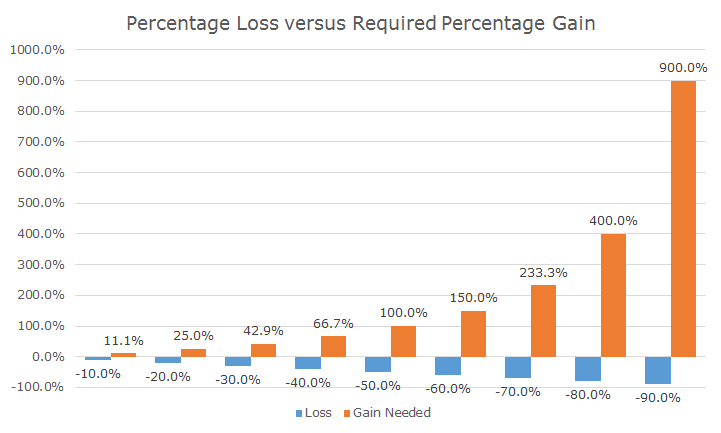
It’s a good reminder of the arithmetic of losses. The math is simple, but it’s still surprising to see what the percentage gain is needed to make up a loss. For example, if you lose 10 percent, you need 11.1 percent to get back to even. That’s not so bad, but if you lose 77.9 like the NASDAQ, you need 350 percent or so in gains to get back to a break even.
The following chart depicts this math in 10 percent intervals. It’s amazing that the losses (in blue) barely appear to change as they get bigger because they pale in comparison to the gains needed (in orange) to get your money back.
In fact, NASDAQ investors that bought in at the very peak were actually made whole nine months ago thanks to dividends. The dividend yield on the NASDAQ is paltry, but every little bit helps. Of course, these numbers aren’t inflation adjusted and while inflation has been low, NASDAQ investors still have a little ways to go before they get all of their purchasing power back.
The talking heads on the financial news have spent a lot of time talking about the differences between the price levels today versus the late 1990s.
Most of the stories include funny anecdotes like the fact that pets.com had a market value of $300 million even though it lost $62 million on $6 million in revenues. Maybe that reminds you of Twitter, which has a $30 billion market value even though it lost $80 million on $300 million in revenue.
While anecdotes are fun, they don’t constitute good data. I took an idea from Warren Buffet’s annual report where he looks at Berkshire’s book value. He writes that the change in per-share book value is a crude device, but it serves as a useful tracking device for estimating intrinsic business value over time.
With that Idea, I found the book value per share for the entire NASDAQ composite for the last 20 years, which is plotted in blue below. I also plotted the price of the NASDAQ in orange to show how valuations have changed over time.
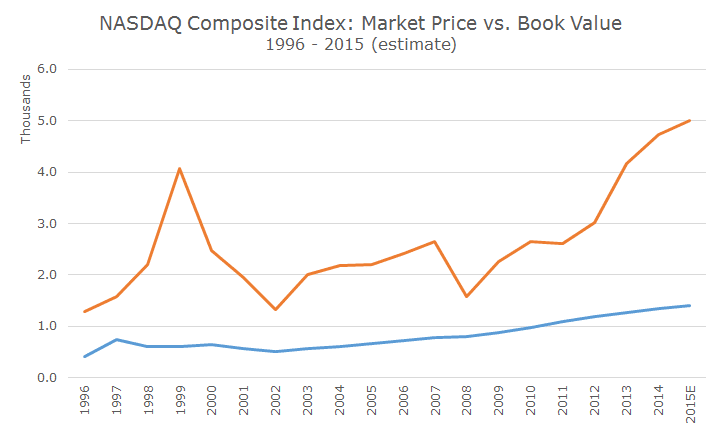
Visually, it looks like the bubble is back, but really, we’re nowhere near the peak valuations of the late 1990s. At the high (using annual data), the price-to-book ratio for the NASDAQ was 6.7, almost double the 3.6 level based on today’s prices and estimates for 2015.
Since the bottom in 2003, book value per share has grown by 7.8 percent, while the price has grown by 7.9 percent – pretty comparable in my view. Like the S&P 500, I would estimate that the NASDAQ is somewhat overvalued, but nothing like it was 15 years ago.
Of course, whether it’s over or undervalued, we would never make a direct investment in the NASDAQ because we don’t want that kind of sector concentration. Even today’s 46 percent weight to technology is way too high.
Still though, despite the concentration, part of the recovery story to 5,000 is diversification. Many stocks like pets.com went out of business, but as a whole, the index survived. It took a long time to make your money back, but that can be controlled with appropriate diversification.
Even bad diversification can work, just not as well as good diversification.
