Watching the bottom fall out for oil prices is really one of the most dramatic things that I’ve witnessed in several years. Thankfully, it hasn’t had too much direct impact on us because we don’t have straight exposure to commodities, click here for the details on why we’ve avoided commodities).
Of course, we’re all affected by the price drop. The good news is easy to remember because I get a reminder every time I fill up my car. The bad news is that we do own energy stocks and the S&P 500 Energy Index is down by almost a third in the last year while the overall market is basically even.
I thought it would be interesting to look at the price of oil in its historical context, so I pulled the price for a barrel of oil back to 1983. I was hoping to find data going back to the 1973 OPEC embargo, but this is all that Bloomberg had available.
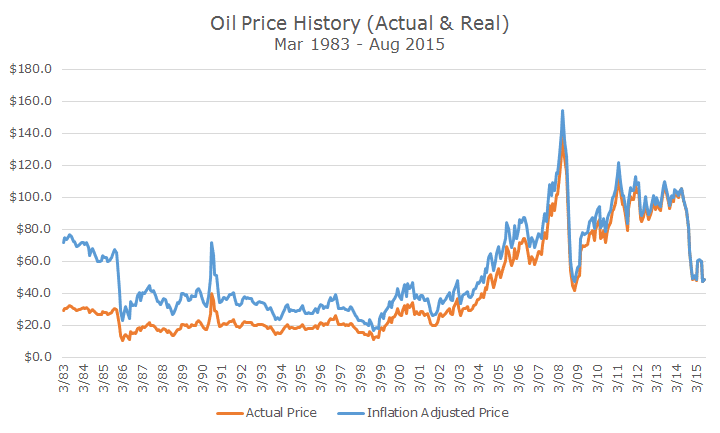
The orange line shows the price as it was at the time, so in March 1983, crude oil was $29.3 per barrel, which, as the blue line shows, is equal to $71.4 per barrel in today’s dollars. As time passes, the two lines converge as inflation has less impact.
I found the chart fascinating for a couple of reasons. First, what caused oil to drop so precipitously in the mid to late 1980s? Like today, it was a mismatch in supply and demand; OPEC kept pumping while demand was falling.
As you can see in the chart, except for a brief spike at the outset of Desert Storm, it tool oil almost two decades to fully recover from the bust in the 1980s.
Although I don’t remember people saying that oil prices were in a bubble in the years leading up to the 2008 financial crisis, I think we can say in retrospect that’s what happened. Oil jumped about 250 percent in the five years prior to the crisis and then it crashed.
The price of oil recovered more than half of what was lost by the middle of last year until it crashed again – the second worst drop in the period covered.
I’ve said before that oil and commodities in general might not be a terrific hedge against inflation. While both worked wonders in the high inflation 1970s, neither has kept pace over the ensuing decades. The high volatility of oil make me think that there are better, less traumatic hedges.
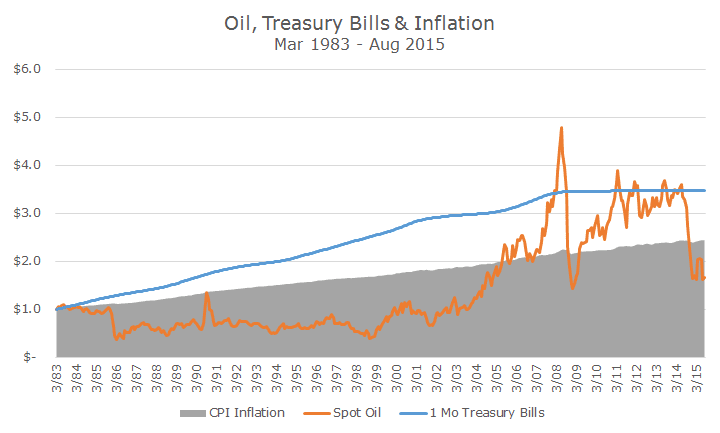
The gray shaded area shows how $1 increased since 1983 due to inflation. It’s not that the dollar became more valuable – it just took $2.44 to buy the same amount of goods and services that $1 bought you back in 1983.
The orange line shows what a dollar ‘invested’ in a barrel of oil would have earned. You can see that it took until 2005 to catch up with inflation, outperformed for a while until the recent crash and now oil hasn’t even kept up with inflation.
The blue line shows what a dollar invested in one-month Treasury bills would have earned over the same period. Notice how the Treasury bills handily outpaced inflation and oil over the entire period without much volatility.
That’s not to say that Treasury bills were perfect – notice how they have been perfectly flat since the 2008 crisis while inflation crept higher when the Federal Reserve brought interest rates to zero.
Of course, there other inflation protections as well. In our bond allocation, we have Treasury Inflation Protected Securities (TIPs) and a small allocation to foreign bonds that are denominated in foreign currencies. If there was an inflation problem, the dollar would likely depreciate, boosting the value of the foreign bonds (and stocks for that matter).
For now, though, inflation isn’t an immediate risk. Right now, the bond market expects inflation to be 1.2 percent for the next five years and 1.55 percent for the next 10 years (for a refresher on how the bond market signals inflation rates, click here).
We plan to continue holding our inflation hedges while staying away from oil and commodities because even though inflation looks benign, you never know when it will be back.

David is a trusted advisor to 50 families, delivering comprehensive financial solutions, including financial planning, investment management, cash management, tax planning, estate planning, and charitable giving. As Chief Investment Officer, he leads the Investment Committee and the research and trading team. His team continuously evaluates investment strategies and securities, working closely with Portfolio Managers to implement them effectively.