I think you know by now that I love charts. I am definitely not saying that I am a chartist – I don’t think I have ever made an investment decision for me or anyone else based on a chart. I simply think that if a picture tells a million words then a chart must at least tell 1,000 (roughly matching my wordcount)
When I saw a blog titled ‘econompic,’ I had to check it out and it’s a great site that can be found here. The fact that the very first chart produced an audible laugh means that I will be back to this blog again in the future.
Without further ado, here is the chart in question:
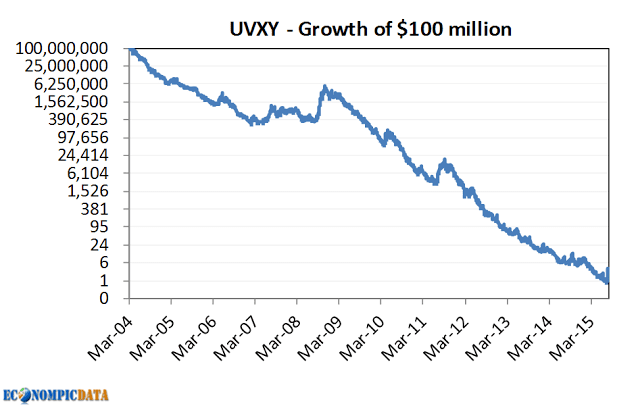
This chart depicts the growth of a $100 million investment in an ETF issued in 2004 that, as of yesterday, would be worth $87. Wow!
I often make charts that show the growth of $1 to give the same starting value to multiple investments for comparison purposes. This fund has lost so much that you couldn’t start with a $1 without resorting to mils. I suppose that you could have used $1 million and ended up with 87 cents, but maybe that’s what I find funny about it.
This is an ‘investment’ in a fund that takes a leveraged position in futures contracts that attempts to track the CBOE Volatility Index, or VIX. That’s an index that I’ve written about recently (click here for a refresher) that is designed to describe the level of volatility that is priced into option contracts.
When traders are anxious or uncertain, they assume that volatility will be higher, which sends option prices lower. When there is less fear or more complacency, it’s assumed that volatility will be lower and option prices are higher.
At some point, someone had a bright idea: what goes up when markets go down? Expected volatility! If we can somehow buy volatility as if it were an asset and not some theoretical construct, we could hedge our portfolio or make a little money when markets are falling.
When I first heard about it years ago, I thought it made sense and since my account often serves as an educational incubator, I bought a different ETF that attempted to own volatility.
Well, that’s why you want my account to be that incubator – I learned the hard way that constant exposure to volatility is very costly. Each month, you have to rollover futures contracts at a higher price, which eats into returns.
Econompic does a great job explaining the details (use the link above) and they show that back in June when volatility was low, the cost of rolling over a contract was equal to 8.5 percent of the investment.
While that number changes, imagine an investment that costs you 8-10 percent to own and you can understand how the ETF in the chart above could lose so much over the past few years.
They also rightly point out that the product has applications, although I can tell you that we’ll never use it. That explains why they have around $275 million in the fund even after all these years of declining (not because they started with billions either).
This EFT reminds me of some old market jokes. 1) How do you make a small fortune in commodities trading? Start with a large fortune. You could certainly insert the VIX futures ETF in place of commodities for that one.
2) How do you lose 90 percent on an investment? First you lose 80 percent and then you get cut in half. This one applies more to the idea that once something is beaten down, you can’t lose much more. It turns out no matter how far something falls, you can always lose 100 percent.
The real lesson from this is it’s critical to understand what you’re buying. We work really hard at this and really do understand what we buy for clients. Except for my poor wife, who has to endure the cost of my education, but she’s on a discounted fee schedule.

David is a trusted advisor to 50 families, delivering comprehensive financial solutions, including financial planning, investment management, cash management, tax planning, estate planning, and charitable giving. As Chief Investment Officer, he leads the Investment Committee and the research and trading team. His team continuously evaluates investment strategies and securities, working closely with Portfolio Managers to implement them effectively.