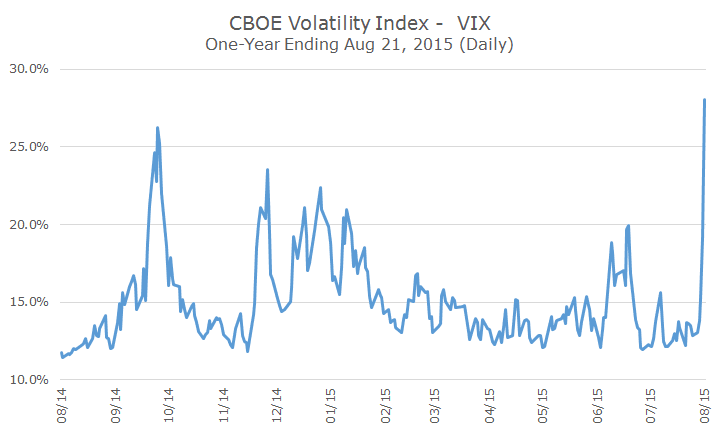
Part of what made last week’s market selloff particularly unsettling was the speed of the decline. So far this year, stocks had been relatively quiet.
For example, the S&P 500 had stayed within a range of minus three percent back in January to plus four percent in July. Then, all of a sudden, stocks fell from the top of that range to the bottom over the course of four days without any particular ‘new’ news to support the fall.
One way to visualize the dramatic shift is to look at the CBOE Volatility Index, or VIX as it is commonly known, that measures the markets view of expected volatility over the next three months. Early in the year, traders expected volatility and then the VIX was very quiet until almost overnight last week.
While that jump is disquieting, I also think it’s useful to put it into perspective. The following chart shows the same index for the last 10-years.
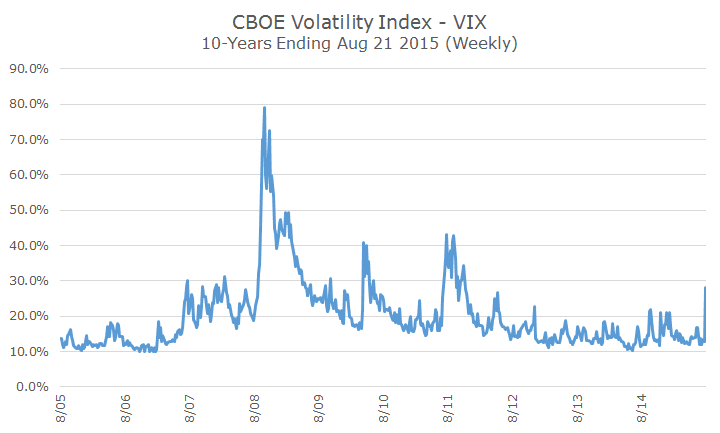
Prior to 2007, the VIX was pretty low, well under 20 percent. In 2007 and the early part of 2008, it ranged from 20 to 30 percent and then blew through the roof when Lehman Brothers went bankrupt.
Although the VIX settled down by the end of 2009, there were two big flare-ups in early 2010 and late 2011, both related to the European sovereign debt crisis. Since then, it’s been unusually low, something I’ve written about before.
Keep in mind that the VIX is also a market estimate of what volatility might be in the coming three months (though it is presented in annualized terms). I thought it would be interesting to see how well the forecast matched up with what happened over the last 10-years.
The following chart shows the forecast volatility, as represented by the VIX on the bottom x-axis and then plots the realized volatility on the left y-axis.
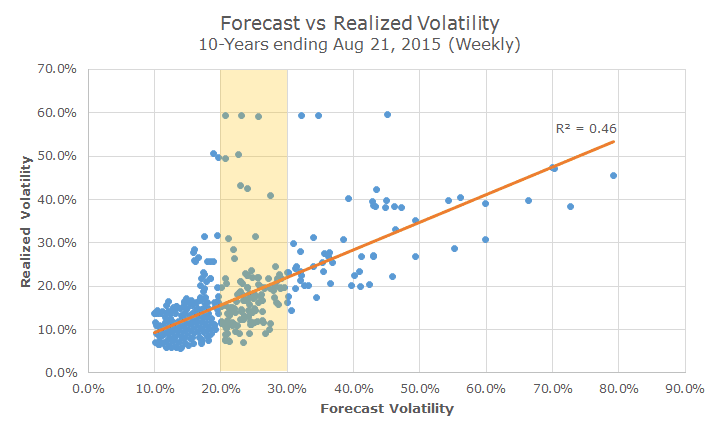
The first thing that pops out to me is that the estimates aren’t terrible – there is some connection between forecast and realized volatility. That upward sloping orange line tells you that there is a positive relationship between the two sets of data. We can tell from the R2 that the correlation between these two data sets are 0.68 (0.46 ^ 2 = 0.68).
I highlighted the forecast volatility between 20 and 30 percent since we closed Friday at 28.03 percent and thought we could look at the range of outcomes for that group.
It turns out that most of the time, the VIX falls back down to normal levels and the forecast volatility doesn’t really come to pass. There are a few instances where realized volatility is higher than the forecast, but that’s pretty uncommon.
This may seem a little esoteric, but the idea is that investors are jumpy and get scared more than you might think. Some of the time, that nervousness is real, but most of the time, the forecast volatility is a false positive.
What you really want to know, though, is whether the higher volatility signals lower returns and just as you might expect me to say, the jury is out on that one.
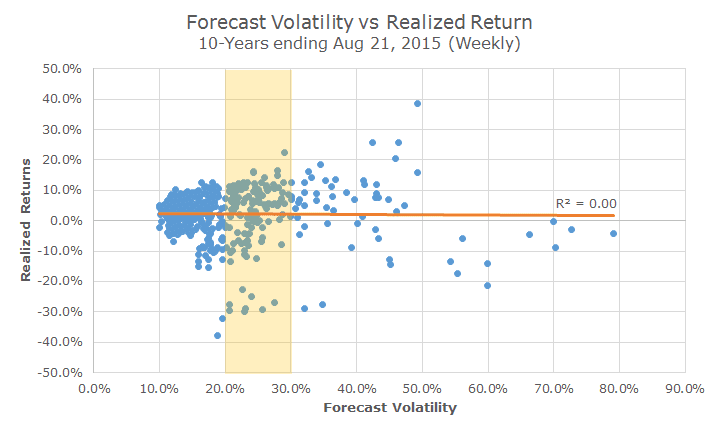
Just like the scatterplot above, I looked at forecast volatility (the VIX) compared to realized market returns over three months to see what relationship I might find. Whereas the orange line was upward sloping above, here it is as flat as a pancake.
The R2 of zero tells us that there is no correlation between higher forecast volatility and realized returns (this just looks at the last 10 years, but longer-term studies show the same).
So, what do we know? We know that the jump in volatility means that we should expect more volatility this fall (coincidently, this is historically the most volatile time for stocks).
Unfortunately, we don’t know much more than we did two weeks ago about what returns might be in the coming weeks or months (or even the next few years).
Ultimately, what we know and what we don’t know about the future hasn’t changed much since we started this business 13-years ago (when the Dow Jones happened to be trading around 8,700).
Then as today, we know that stocks earn higher returns than cash and bonds, but are highly volatile. If you can live through the volatility, a buy and hold approach has historically worked very well.
Although no one can predict the future, we think that relationship will continue to be true over the long-term regardless of what happens in the short run in China, other emerging markets, the oil market or with the timing of the forthcoming Fed liftoff.
Protect yourself not by trying to time the market, but by settling on the right mix of high-risk stocks and low risk bonds from the get-go.
This is investing. Stick to it through thick and thin and we think it will pay off handsomely.