In our retirement planning model, the Acropolis Financial Forecaster, there are essentially five key variables that affect the probability of meeting your goals. They are as follows:
- Saving Before Retirement
- When to Retire
- Spending in Retirement
- Market Returns & Inflation Rate
- Portfolio Risk
The first three factors are entirely under your control and the second one is the most critical because the timing of your retirement stops contributions to your nest egg and starts the process of shrinking your savings through withdrawals to support your lifestyle that outside income once provided.
In our model, we’ve always included three phases to reflect different retiree spending patterns. We’ve always believed that the first five or ten years is the most expensive (and potentially fun) and that costs tend to go down over time (we adjust for inflation, of course).
I recently came across some data from the Bureau of Labor Statistics (BLS) that helps put some numbers on the concept of varied retirement spending, they are as follows:
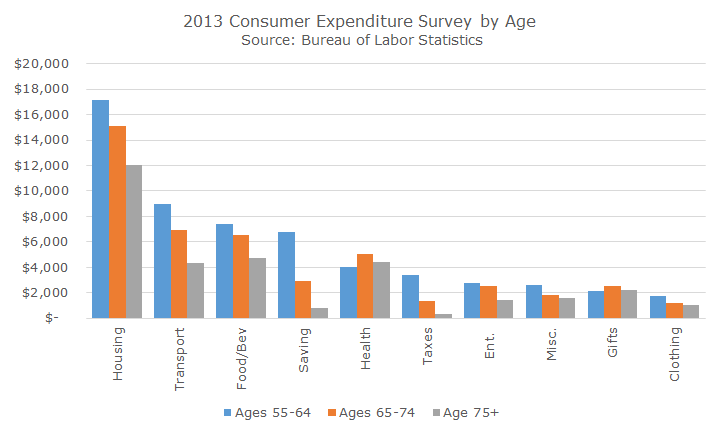
The blue columns reflect spending by category for people between ages 55-64, the time periods that we would normally think of as peak earnings years prior to retirement. The three biggest categories, housing, transportation and food, represent almost two-thirds of all expenditures for pre-retirees.
Between ages 65-74, when we can assume that the majority of people are in retirement, spending in those three categories fall meaningfully in dollar terms, from a total of $33,553 to $28,582, which is a 14.8 percent drop.
For those 75 and older, the top three spending categories shift a little bit – higher healthcare costs and lower transportation costs (this makes sense since young people drive old people to the doctor), but still represent about two-thirds of total spending.
There are very noticeable shifts in spending in some of the smaller categories as well. For example, saving represents about 12 percent of spending (Spending on saving? It turns out that most of the saving is in the form of Social Security tax. For accounting purposes, the BLS counts savings as a line item, which makes sense and makes for good word play). For those 65-74, saving drops by more than half and then drops another 75 percent for those older than 75.
The same trend applies in the tax category, which makes sense since wages and salary are gone and the income is passive.
Overall, spending drops by about 10 percent between ages 55-64 and ages 65-74. For those older than 75, spending is about 58 percent of what it was during the last ten years of work.
This is consistent with the old rule of thumb about needing 80 percent of your salary to retire, but includes an important factor to consider. The rule of thumb implies a constant rate of 80 percent. On average, that may be true, but our original idea of multiple phases with different spending levels makes sense.
While this data is helpful, it summarizes the results for all Americans, but our client base is a little different in both assets and income. I was able to find data for high income earners, defined by people with incomes of more than $150,000 (the median income turned out to be ~$241,000), but couldn’t find high income data that was then sorted by age.
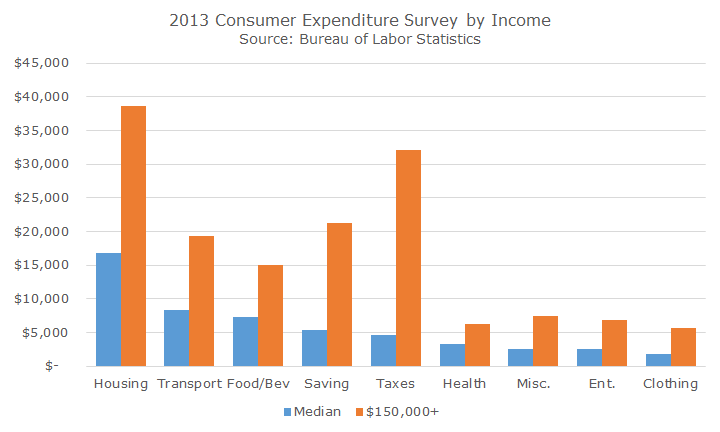
In general, you see higher spending across the board, especially on housing, taxes and savings. As we noted from the spending by age, the savings and taxes will decline, but the housing may not. A lot of people downsize when their kids move out and they don’t need as much space, but many maintain their primary residence and the upkeep that goes with it.
Incidentally, the BLS report is a lot of fun to look at (here’s the link). I’ve summarized some of the categories (reading had its own, for example), but there is also a lot of subcategory information in the report in case you want to see how much people spend on pork versus cereals or laundry supplies versus electricity.
You can bet that I’ll be taking a more nuanced look at our budget. I was relieved to see that typical 35-44 year old spends $1,046 per year on their cell phone but am thinking that we spent more than $718 on clothing for women and girls. I have a wife and two daughters – does that sound right to you?

David is a trusted advisor to 50 families, delivering comprehensive financial solutions, including financial planning, investment management, cash management, tax planning, estate planning, and charitable giving. As Chief Investment Officer, he leads the Investment Committee and the research and trading team. His team continuously evaluates investment strategies and securities, working closely with Portfolio Managers to implement them effectively.