The teacher from The Simpsons would have you believe that there is no such month as Rocktober, but looking at the returns from last month, I have to disagree!
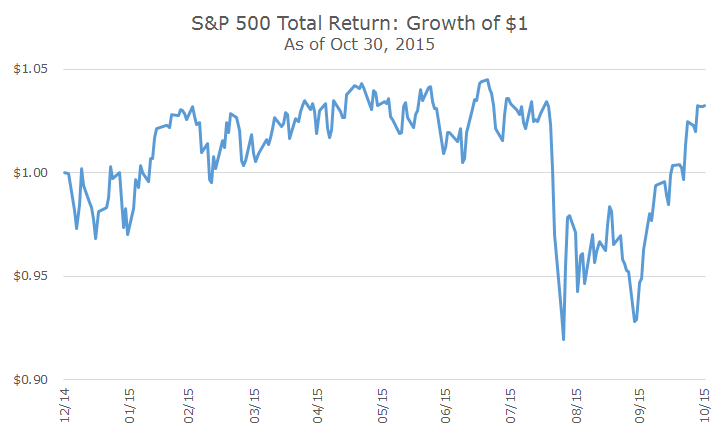
Stocks have recovered all of their losses from the August/September correction, are now positive for the year and within a few percent of the all time highs set in May.
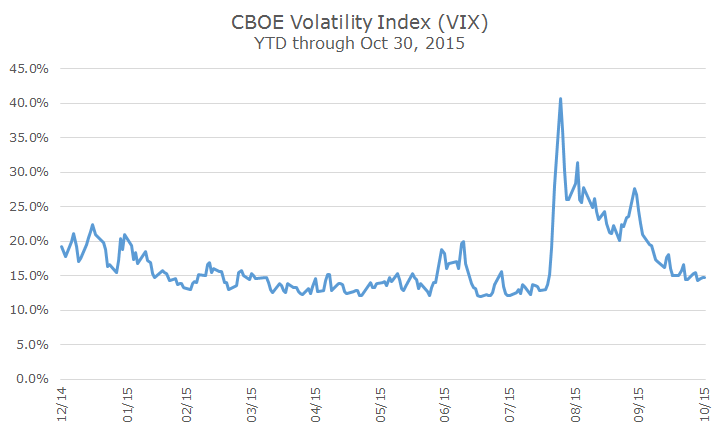
You can see that the nervousness that struck markets sharply in August is almost entirely gone as well, with the CBOE Volatility Index (or VIX) has dropped back to the low levels that we saw earlier this year. Keep in mind, though, that volatility can come out of nowhere any time, just as it did in August.
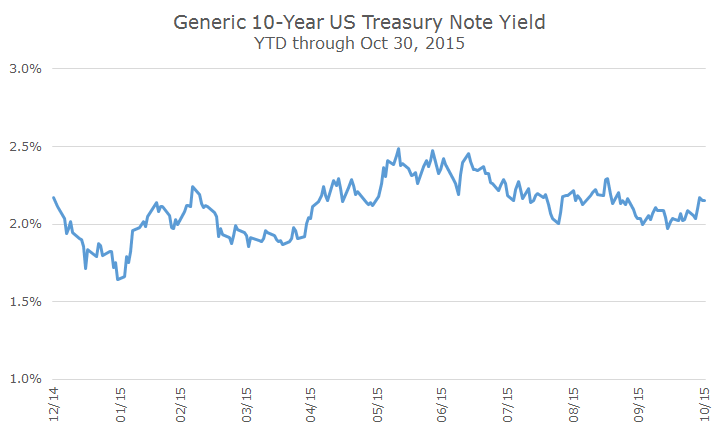
Finally, I thought I would throw in a snapshot of the yield for the 10-year US Treasury this year. What you can see here is that it has stayed in a relative tight trading range for the year. Although the yield dipped below two percent in the first part of the year, it’s been pretty steady between 2-2.5 percent since then.
I find it hard to believe that there are just two months left in 2015. Given the volatility, it feels like a lot happened, although with almost all major asset class returns between zero and five percent, you could conclude at this point that almost nothing happened at all.
We’ll just have to see what the few remaining months bring, but I doubt it will be as awesome as Rocktober.