Last year was a mixed bag for stocks. The headline index that most professional indexes follow, the S&P 500 had a great year, up 13.68 percent. I looked at all of the annual returns since 1926, the year when good quality data is thought to begin, and found that 2014 ranks 46th out of 89 years, putting it in the 51st percentile – basically the center of the distribution of returns.
Early in 2014, I noticed that the returns for the S&P 500 were not only exceptional in returns, having gained 32.39 percent, but also in their low volatility. In 2013 and using monthly data, the annualized volatility was 8.48 percent. That’s pretty low – in about the 10th percentile, meaning that markets are more volatile about 90 percent of the time.
As a result, the Sharpe ratio, which looks at the excess return of an asset over cash divided by the volatility, was the highest in history, looking at calendar returns. If you look at rolling 12-month data, the Sharpe ratio in 2013 was in the 97th percentile.
I bring that up because 2014 was essentially a continuation of the same thing: solid returns with very little volatility. Last year, volatility was even lower, but since returns weren’t as high, the Sharpe Ratio wasn’t as good – but who would expect a repeat of the results in the 97th percentile? In 2014, the Sharpe ratio was in the 75th percentile of all 12-month rolling returns – still outstanding.
The strength of the S&P 500 stands out compared to other index returns as well. The chart below shows the index returns for the equity asset classes where we invest.
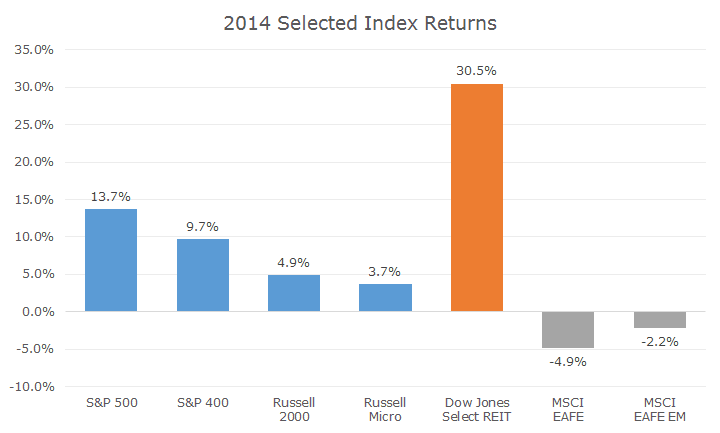
The first four indexes, in blue, represent the total US market in various cuts by size – the S&P 500 represents large cap stocks, the S&P 400 denotes mid cap stocks, the Russell 2000 is the most commonly used proxy for small cap stocks and the Russell Micro index covers micro cap stocks.
Notice how the S&P 500 beat all of the other indexes, in some cases by a fair margin. The difference in returns between the large cap index and the micro cap index is 10 percent – an unusually large margin. On average, micro cap stocks outperform large cap stocks, but the returns are highly volatile and we definitely saw this in 2014.
REITs, in orange, were the standout performer in 2014, gaining by nearly one-third. REITs benefited from falling interest rates and are a unique asset – click here for a more detailed article about REITs. I should note that I’m talking about publicly traded REITs, not the private placement versions that had a hard time in 2014 (click here fore more).
Overseas markets, in grey, fared poorly as both developed and emerging markets lost value last year. In retrospect, that’s not surprising given the economic troubles in Japan and the eurozone, not to mention the conflict in Russia and falling oil prices, which tend to hurt emerging market economies.
I was recently quoted by the St. Louis Post-Dispatch on the current cheapness of overseas stocks, and if you can permit the shameless self-promotion for a moment, click here to see the article. Now that that’s out of the way, I want to also promote a series of videos that two of the business writers at the Post are doing once a week.
Basically, business columnists Jim Gallagher and David Nicklaus sit down in various bars, restaurants and other classic St. Louis venues and chew the fat on markets, investing, economics and financial planning – what’s not to love? You can find an archive of their videos by clicking here.
I also thought it would be interesting to plot last year’s return along with the returns for the last 10 years, and the results are interesting.
2015-01-02 Stocks Enjoyed Amazing Results in 2014 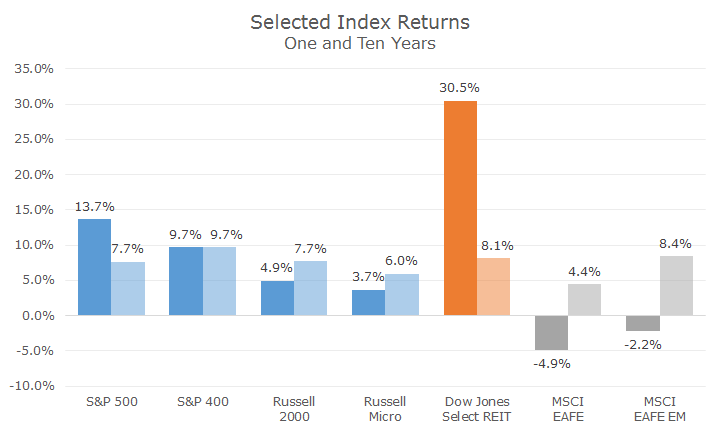
The relationship between the various sizes of US stocks isn’t so straight – mid caps fared best, large and small caps were the same, and while micro cap still came in last, it was still a decent return. REITs also fared well – better than the S&P 500. Developed overseas stocks were the worst of the bunch, but emerging markets stocks were the second best performing asset class.
Now that we’ve tackled stocks, next week we’ll cover bonds, the economy and a look at 2015.