A correction is usually defined as a peak-to-trough decline of 10- percent using closing prices. Under that definition, we’re not quite at a correction, since the S&P 500 is ‘only’ down -9.28 percent since the recent high on September 20th.
I think that such a strict definition is a little bit silly, so I’m calling it a correction since we’re very close using closing prices, and we crossed the 10-percent threshold if you use intraday prices.
More importantly, in my opinion, is that everywhere you look outside of the S&P 500, you find losses in excess of the ‘magic’ 10-percent standard.
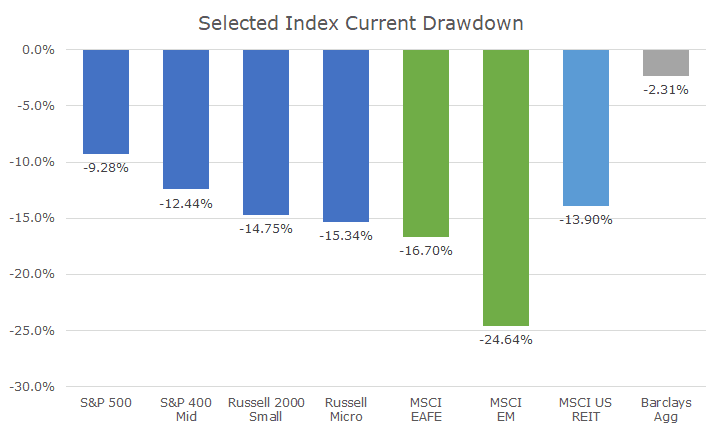
All of the other US asset classes measured by market capitalization are down well more than 10 percent. The international markets are down even more, with emerging down more than -20 percent, the threshold for a bear market.
Even bonds are down from their highs, although I threw them onto the chart just to show that a selloff in bonds is much less severe than a selloff in stocks, highlighting their relative safety.
I don’t think it makes a tremendous difference, but I should note that in the US, the peak market points to measure the drawdown are in September, but for the non-US markets, the peak was back in January. The peak in bonds was the end of last year.
It is somewhat surprising to see such an abrupt, broad selloff while the economy is doing so well. Markets seem to be worried, all of a sudden, that the best is behind us, and the economy may in fact be too hot.
Two weeks ago, I wrote that we could trace the roots of the selloff to rising interest rates (click here for the article). I continue to believe that, but it appears that some of the stories that seemed secondary before have been promoted.
One of the major concerns now is that US stocks have hit ‘peak’ profits and profit margins. Last week, I wrote that stocks were powered by earnings, and, so far, the season looked pretty good.
Since that article, earnings as a whole were strong, but tech bellwethers Amazon and Google results were worse than expected with weak guidance, which brought the risks of the FAANG stocks to the forefront (FAANG = Facebook, Apple, Amazon, Netflix and Google).
For some time, these five stocks have been able to shake off all of the concerns facing the rest of the market, but this time may be different. It’s still too early to say, but if that’s the case, it would represent a major shift in investor sentiment.
Since the 2008 financial crisis, there haven’t been many corrections, and when they have happened, they’ve resolved themselves very quickly. The chart below shows the corrections as I defined them.
Defining them is hard actually. For example, I excluded the setbacks coming out of the 2008 financial crisis, since I viewed them as part of the crisis rather than their own, separate instances.
That happened again below in the selloff that started in July 2015 and ended one year later (in yellow). You can see that stocks fall sharply, recover almost all the way back to breakeven, but then selloff sharply again around day 121. I see this as one correction because the first one never really recovered, but others might classify as a second correction.
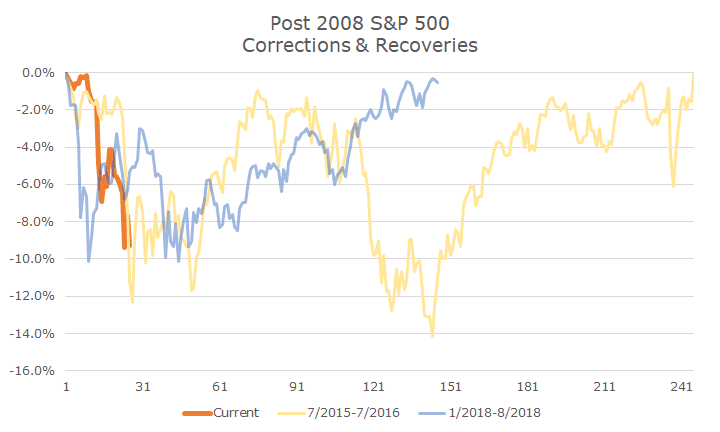
The current correction, in orange, is pretty self explanatory, and although it feels like it came out of nowhere, you can see that the other two start basically the same way. In fact, one of them started in late January of this year (in blue), and we just got ourselves out of it in September.
I’m showing this chart to demonstrate how quickly corrections can start, and how it takes a little time to recover from them. What I don’t want you to think, though, is that this correction will follow the same path as the others, we just don’t know what will happen. The chart above only has two (or three) data points to consider, which isn’t enough to draw any inferences.
There is some good reason to think that this correction may be different than the other ones too, but there’s always good reason to think that. For example, stocks were overvalued at the start of each of the other two corrections pictured, but that didn’t stop a speedy recovery. Stocks are overvalued today, and it’s impossible to know whether that will be factor in where prices go from here.
As always, we rely on our asset allocation to reduce market risk and, more importantly, we’ve planned for corrections (and bear markets, and financial crisis’) in our financial planning models. While a correction (or otherwise) would lower the probability of success for clients, the recovery that follows would improve them again.
When your strategy is to stay the course, it’s important to actually stay the course. That said, there is not time like the present to make sure that you’re comfortable with your stock/bond mix, something I’ve said for years in good markets and bad.