The good news is that the S&P 500 is up almost 14 percent this year through yesterday. The bad news is that no other equity asset class is doing nearly as well.
Most clients that I’ve been talking to understand why we diversify, but a few of them have said something along these lines: ‘Dave, I hear what you’re saying and you’re probably right, but shouldn’t we do something different? I mean, Japan and Europe really look like dogs and I don’t see anything turning around there anytime soon.’
And, I have to agree – Japan and Europe both look like basket cases at this point and the policy responses haven’t been successful, whether it’s Japan’s massive quantitative easing or Europe’s failure to launch a meaningful bond buying program.
Still, in my heart of hearts, I think that global diversification still makes sense. In fact, I think adding to non-US markets is appealing now on Warren Buffet’s adage about being greedy when others are fearful and fearful when others are greedy.
Since we don’t do things on anyone’s gut feeling around here, I decided to pull some data. I decided to pull the MSCI World exUS index and the MSCI US index since their inception in 1970. MSCI is the leading index provider for non-US securities and using these two indexes allows me to look at the world in two consistently created components: the US versus the rest of the world.
I was shocked by the results: since 1970 through Oct 31, 2014, the MSCI US index returned 9.14 percent. The MSCI World exUS earned 9.15 percent annually – just one one-hundredth of a percent difference in annual returns (otherwise known as: the same).
The MSCI World exUS index has been more volatile, with an annualized standard deviation of 17.16 percent, compared to 15.36 percent, which is about 10-12 percent more volatility.
The Nobel Prize winning financial economist, Harry Markowitz, observed in the 1950s that investors are risk averse in the sense that if they are given the choice between two portfolios with the same return, they would choose the portfolio with less volatility.
On that basis, if we assume that the future will look like the past, shouldn’t we simply invest in the US and forget the rest of the world? That’s what Warren Buffet said when he announced that his trust should be invested 90 percent in the S&P 500 and 10 percent in cash.
Markowitz, who really is one of the most important people in modern financial history, showed that as long as two assets aren’t perfectly correlated, two assets could have a lower volatility combined than either one alone. In fact, a combination of these two asset classes in a roughly 65/35 US/exUS split, is about five percent less volatile than just holding the US index.
This relationship, known as the ‘efficient frontier’ is depicted in the chart below.
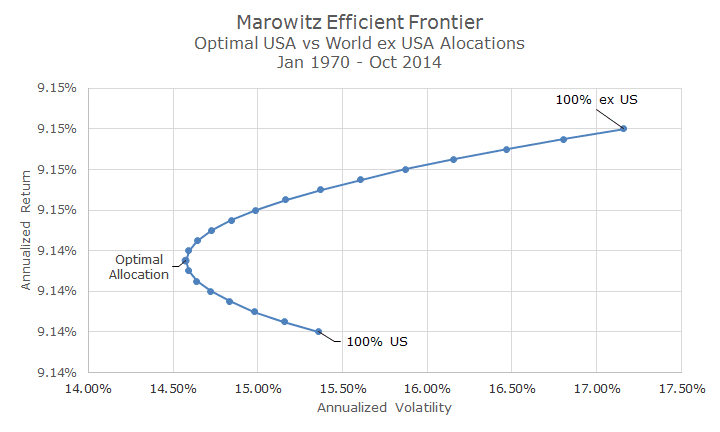
Each plot on the chart shows the risk/return characteristics for portfolios with varying combinations of the US and exUS indexes. The top right portfolio has the higher return (but a hair) and the highest volatility. The portfolio on the bottom is all US and has a lower return and lower volatility. If we had to choose just one, that’s the one we would pick.
However, all of the other dots represent combinations of the two in five percent increments. The optimal allocation, where you get the highest return for the least amount of volatility is on the left. It happens to be a 65/35 US/exUS split, which is pretty close to the 75/35 US/exUS split that we use.
Now, this is all very elegant and I believe it explicitly, there are a few grains of salt that go along with this kind of analysis.
Most importantly, we’re plotting this chart with perfect hindsight – we know that a 65/35 US/exUS is the optimal split only because the race is over and we can see exactly what happened. It’s not possible to find the optimal allocation beforehand.
Yes, a model can spit out an optimal result, but the assumptions you use matter far more than the output. The math is sophisticated, but like every model, its garbage in and garbage out, so it’s important not to get carried away.
Second, no matter what the model says and even with perfect hindsight, it’s a long time horizon – 44 years in this case. One asset class can do a lot better than the other for extended periods of time.
Over the last five years, for example, the MSCI US index has outperformed the MSCI exUS index by 10 percentage points per year. That’s a big deal and it takes a lot of discipline to stay put.
There other technical assumptions that are difficult to deal with in real life, but that’s a whole story in itself.
The point, though, is that global investing still makes sense no matter what we see in the day-to-day news about Japanese Prime Minister Shinzo Abe or European Central Bank President Mario Draghi.
