One of the justified criticisms of modern finance is that it relies too heavily on the normal distribution curve – also known as the ‘bell curve.’
In fact, there’s a classic joke (that I think I’ve told here before) about the finance professional that has his head in the oven and feet in the freezer, but on average, feels fine.
Critics argue that the normal distribution doesn’t capture the true ‘tail’ risks – the tail referring to infrequent outliers at each end of the distribution.
Before the Natalie Portman movie, Nassim Taleb wrote a book entitled ‘Black Swan’ referring to so-called ‘tail events’ that should be rare and infrequent, happen more often than the normal distribution curve would expect and have major consequences.
The name Black Swan comes from the ‘discovery’ of a black swan in Australia by a Dutch explorer. Up until that point, only white swans had been observed in the Western world and it was widely assumed that all swans are white.
In the book Taleb argues that black swans are a surprise, have a major effect and are inappropriately rationalized after the fact. He lists the rise of the Internet, World War I, the end of the USSR and the attacks on 9/11 as examples of black swans.
The book, principally about uncertainty and the limits of human knowledge became wildly popular on Wall Street in 2008, principally because it was published in 2007 and people thought they sounded smart using the term.
I recently saw the following table, created by Credit Suisse and found in the Journal of Indexes, that really demonstrates the magnitude of the Black Swan in 2008.
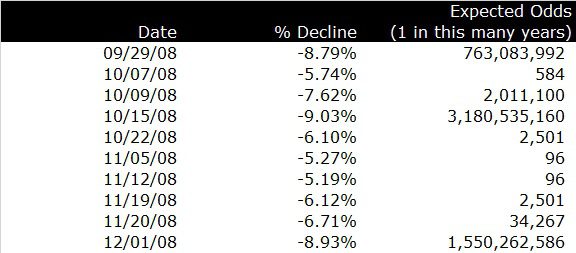
Really, this is remarkable data and drives home the concept. In this 83-day period, there were 10 days that were so bad were so bad that nearly every person living should have only seen one of these days in their lifetime.
The ‘good’ days in the table had losses of ~5.25 percent and the normal distribution curve would only predict days this bad once in 96 years (the odds of occurrence 1:96).
The -9.03 percent drop on October 15th should only occur one time in the course of 3.2 billion years – and the world is only thought to be 4.5 billion years old!
So, any rational person has to conclude that the normal distribution curve fails to predict these black swan events. I would prefer to think that since these things just happened, that I won’t be around to see them occur again, but it’s just not true.
Chances are that most of us will see them again – and there are always new records to be broken (a red swan?).
Despite the failure of the bell curve to predict these one-day declines, there are a few useful lessons.
First, models are not reality. The have flaws but are still useful – you don’t throw them away because they don’t work perfectly – you take them with a grain of salt and get as much or value out of the process of creating or using the model over the output.
Second, you have to remember that owning a stock represents a small ownership in a business. What got me through the crisis was the belief that our basic system, while injured, wasn’t dying, which made a recovery possible.
Third, the 2008 swans weren’t exactly black; we had done it all before. Of the 10 bad days in the table, only one of them registers on the list of top 10 bad days of all time.
Even the swans that Taleb mentions like 9/11 or the Internet are newer versions of old issues: war and technological change. Those were important, of course, but were they truly different than Pearl Harbor or the telephone?
The existence of black swans doesn’t change anything. It’s just reminder of what we already know: the world is an uncertain place.
Now, if you’ll excuse me, I have to prepare for an alien invasion.