It’s not a stretch to say that 2016 has been full of surprises!
One of the big surprises from our perspective up until the election was the decline in interest rates and corresponding strong return that bonds delivered.
I wrote about the surprising decline in yields as early as February and was going a little bananas as yields throughout the world went negative (here, here and here). We never went negative in the US, but negative yields were part of the overall phenomenon of declining interest rates.
If you look at the chart below, you can see that yields fell dramatically in the first month of the year for the two-year Treasury (in blue), 10-year Treasury (in orange) and the Barclays Aggregate bond index.
Yields continued to fall, albeit less dramatically, until mid-summer when investors started to get the sense that the Federal Reserve would increase the overnight rate (the two-year is said to be the best proxy for the market’s view of where rates may be headed).
You can see that the big move, though, is right after the election when all three yields rise dramatically – especially the 10-year Treasury and the Aggregate.
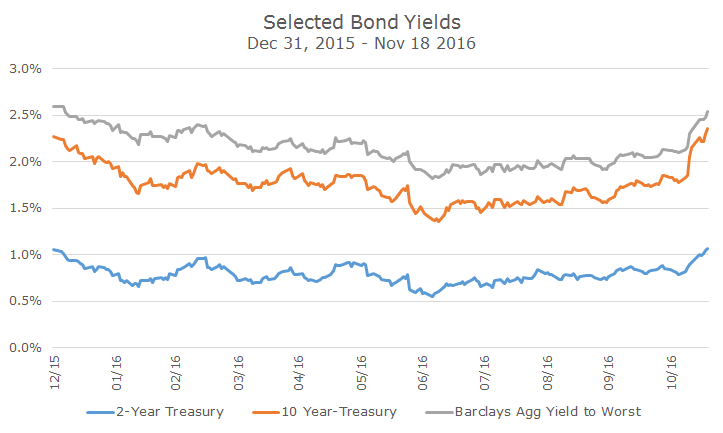
While the declines were meaningful and the recent jump was relatively spectacular (can changes in the bond market really be spectacular?), the most interesting thing to me is that yields are pretty much where they started the year.
If you had asked me on January 1st what the Aggregate would earn over the course of the coming year, I would have answered with a disclaimer that it was impossible to say.
Then, I would have looked at the current yield, which at the time was a little more than 2.5 percent and said something along those lines, assuming that rates didn’t move much.
The chart below shows what a dollar invested in the Aggregate would have earned through Friday. After the move higher and dramatic selloff, the total return is almost exactly 2.5 percent – just what we would guess if there was ‘no change’ in yields.
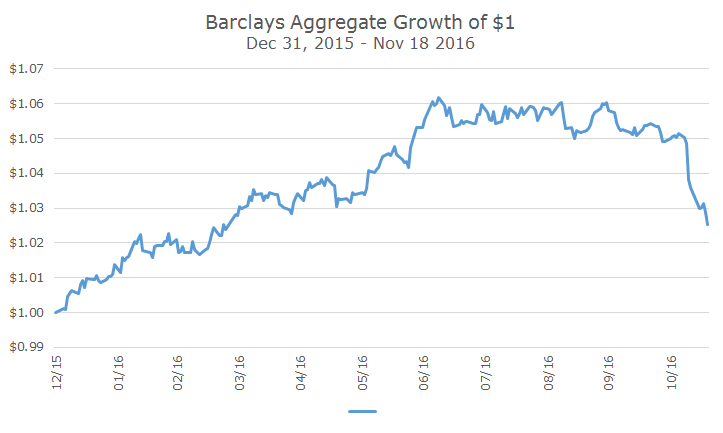
Although we’ve got a month and a half before the year ends and 2016 feels like a year where anything can happen – bond returns are almost exactly what you would have expected back in January.
Despite all of the action, not much has really changed, which is why we try not to focus too much on the short-term movements.

David is a trusted advisor to 50 families, delivering comprehensive financial solutions, including financial planning, investment management, cash management, tax planning, estate planning, and charitable giving. As Chief Investment Officer, he leads the Investment Committee and the research and trading team. His team continuously evaluates investment strategies and securities, working closely with Portfolio Managers to implement them effectively.