Last year, the researchers at Bloomberg developed an index that assigned the probability of a recession to the US economy (and others around the world) based on a variety of economic data.
I find the index interesting because, unlike a lot of other signals that attempt to do the same thing, this one seems to predict the recession before the recession actually hits.
That’s the good news. The bad news, perhaps not surprisingly, was that despite my efforts, I couldn’t find a way to time the stock market despite having a little advance warning about a forthcoming recession.
Even if I had, though, two recessions aren’t enough data to draw a meaningful conclusion. The data would need to span decades in the US and multiple countries overseas.
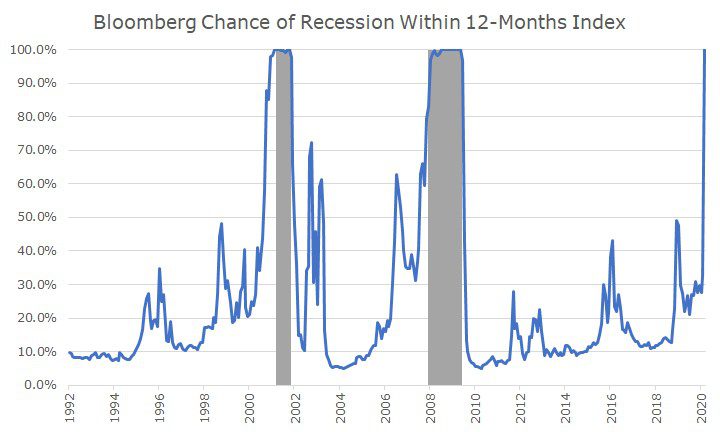
Still, I like to look at the chart to try and assess the magnitude of changing economic data. When stocks sold off at the end of 2018, for example, you could see the chance of recession jumping from somewhere around 10 percent to nearly 50 percent.
That recession didn’t happen, and that makes sense because the estimate only suggested that it was a coin toss, and the Federal Reserve came to the rescue by cutting interest rates and reactivating their balance sheet.
At this point, the National Bureau of Economic Research (NBER) hasn’t called our current situation a recession. They typically do so 6-12 months after the fact.
And unlike the popular belief that a recession is defined as two consecutive quarters of economic contraction as measured by Gross Domestic Product (GDP), they take a much more holistic approach to the definition.
Even though they haven’t called it, would anyone say that we’re not in a recession? Of course not! The questions now aren’t whether one is going to happen, but the depth and duration of the recession.
And then, the question will be how the economy recovers from the recession. You read all the time people saying it will be a ‘V-shaped’ recovery, or a ‘L-shaped’ recovery – or even a recovery that looks like the symbol for a square root.
And, of course, nobody knows this, including the PhDs at Bloomberg who came up with that nicely fitted chart (too fitted is a good question for another day).
The shape of the recovery is what the stock market is trying to figure out each day as it gets new information about the economy, corporate earnings and the status of the virus. It’s a very messy process, which is why prices are so volatile.
When the odds of a recession are something like 10 percent, markets are pretty smooth, but when something bad may be on the horizon or is already here even if we can’t measure it, it gets very volatile. As uncomfortable as it is, though, it’s a normal part of the process.
Odd as it may sound, it’s nice to have something normal in our lives right now, even if it’s high volatility.

David is a trusted advisor to 50 families, delivering comprehensive financial solutions, including financial planning, investment management, cash management, tax planning, estate planning, and charitable giving. As Chief Investment Officer, he leads the Investment Committee and the research and trading team. His team continuously evaluates investment strategies and securities, working closely with Portfolio Managers to implement them effectively.