Acropolis will turn 12 in less than 10 days and I can’t help reflect on what has changed over that time and what has stayed the same.
Since the beginning, we’ve used index funds, but the way we use them has changed fairly dramatically in some cases.
Take small cap stocks, for example. A dozen years ago, we used exchange-traded-funds (ETFs) as the core component of our small cap allocation and individual stocks as satellites around the core (a strategy also called ‘hub and spoke’ periodically).
We were also early adopters of ETFs due to their low expense ratios and tax efficiency. Today, we still use ETFs in our small cap allocation, but we’ve dropped the individual stocks because we just couldn’t get diversified enough with such a small allocation.
To complement our ETF core, we now use mutual funds that have specific exposures to factors like value and momentum.
We’ve also learned that not all indexes are created equal. For example, after reading a book by the Yale Chief Investment Officer, David Swenson, we discovered that the Russell 2000 is an inferior small cap index compared to both the academic data and other commercial indexes.
Part of the reason you invest in small cap stocks is to diversify, but it’s also in hopes of earning higher returns. The academics that discovered that small cap stocks tend to outperform large cap stocks referred to this phenomenon as the ‘size premium.’
To capitalize on the academic work, Russell Investments created a large and small cap index in 1984 that institutional investors could use to benchmark investment managers. The index dates back to 1979, and the large cap index has actually outperformed the small cap index by 0.24 percent per year contrary to the academic findings.
Does that mean the academics were wrong? Nope. As I mentioned, David Swenson wrote about the problem and it was well known among institutional investors. Other index providers like MSCI and S&P created competing small cap indexes, although they don’t go back as far.

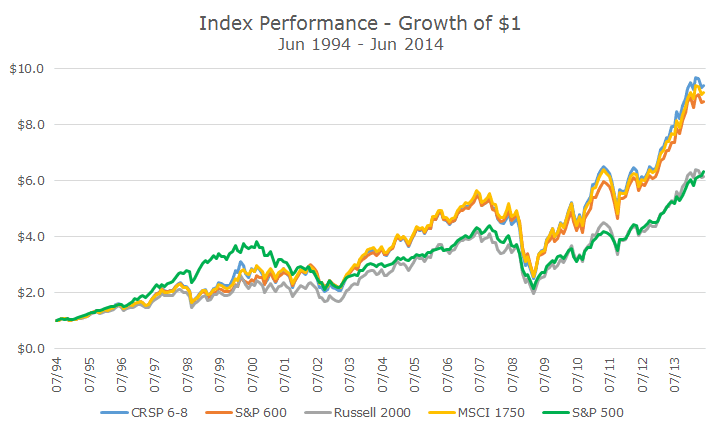
As you can see in the chart, over the last 20 years (a period that captures all of the commercial indexes), two of the commercial indexes and the academic index (labeled CRSP 6-8) have all earned around 12 percent per year.
The Russell 2000 has earned about two percent less per year, consistent with the returns for large cap stocks, as represented by the S&P 500 in gray.
Over 20 years, the compounding effect of this difference is huge.
You might think that ‘everyone’ knows this by now, but that’s not the case. The iShares product that tracks the Russell 2000 has $23.4 billion in assets under management (AUM), while the iShares product that tracks the S&P 600 only has $13.3 billion.
Indeed, we’ve learned a lot since we started Acropolis. Of course, I think we did a great job before, but today, I think we’re even better.

David is a trusted advisor to 50 families, delivering comprehensive financial solutions, including financial planning, investment management, cash management, tax planning, estate planning, and charitable giving. As Chief Investment Officer, he leads the Investment Committee and the research and trading team. His team continuously evaluates investment strategies and securities, working closely with Portfolio Managers to implement them effectively.