Yesterday, Ryan Craft and Cliff Reynolds sent out their email newsletter, ALM Insights. If you don’t know what ALM stands for, it just means that you’re not a banker (it stands for Asset Liability Management).
As you know, banks take deposits from folks like you and me and lend the money out to consumers and businesses. But they can’t loan out all of the money that they take in, they have to keep some in reserve and must invest in conservatively in bonds.
In the funny world of banking, the deposits are liabilities and the loans and bonds are assets. It seems funny at first, but your cash is your asset, not theirs!
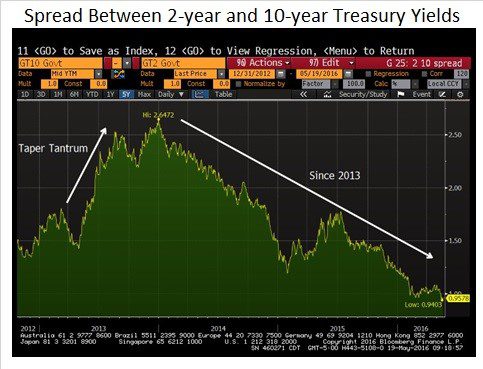
Yesterday’s ALM Insights contained the following chart, which I thought was pretty interesting for us regular folks:
It shows the difference between the yield on the 10-year Treasury and the two-year Treasury, or ‘twos and tens’ as they say in the bond market.
All investors look at the shape of the yield curve to figure out what yields make sense for term of the loan. When the curve is steep, as it was at the end of 2013, it can make sense to buy longer term bonds. When the curve is flat, like it is now, then the longer-term bonds may not make as much sense.
Two of the bond funds that we use for private clients automatically adjust the duration of the portfolio based on the shape of the yield curve.
It’s an interesting approach that we think is better than a straight index fund (this is passive, but not indexed, an important distinction that deserves more words than I have for it today).
I wrote a detailed piece on this strategy, known as variable maturity, several years ago, which can be found here.
The piece in ALM Insights is terrific, but it’s pretty specific to banks. So, you may not want to read it, but if you are a banker, know a banker or love a banker, send them over to ALM headquarters here, sign them up for ALM Insights or, best yet, have them call Ryan or Cliff at the numbers below.


