Inflation is hard to measure, which is why there are many ways to measure it.
In addition to the Consumer Price Inflation (CPI) indexes that I’ve discussed in recent months, there are also Producer Price Indexes (PPI), the Personal Consumption Expenditures (PCE) indexes, the Gross Domestic Product (GDP) purchased price index, the GDP price index, and the GDP Price Deflator index. Oh my!
While I don’t intend for this letter to turn into an analysis of inflation minutiae, I do want to describe the PCE indexes because that is what the Federal Reserve watches closely while setting interest rate policy.
And while the news and this letter have paid a lot of attention to the 9.1 percent headline CPI over the last year, the PCE rate is substantially lower, which, in theory, makes the Fed’s job of getting inflation (or PCE) down to their target rate of two percent.
As noted before, the CPI is designed to measure the cost of living for urban consumers, which account for about 93 percent of the population. The Bureau of Labor Statistics measures the changing prices for goods and services based on consumer spending.
The PCE is produced by the Bureau of Economic Analysis (BEA) and measures the change in prices for all consumption items, not just those paid for out-of-pocket by consumers.
For example, the CPI captures direct healthcare expenses like premiums, deductibles, and co-payments – everything that consumers pay for out-of-pocket.
The PCE captures those expenses but also includes the costs that aren’t paid directly by the consumer: the premiums covered by the employer and Medicare/Medicaid costs.
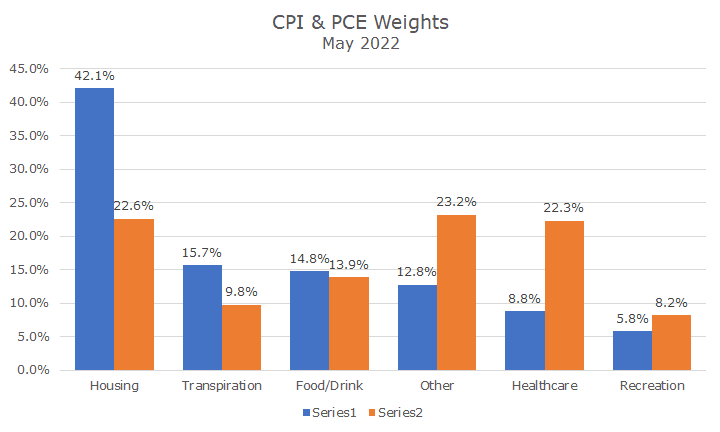
As a result, the weights of the baskets are very different – the weight for healthcare in CPI is 8.8 percent, but in the PCE index, which includes all healthcare spending, the weight is 22.3 percent.
And that’s not even the biggest difference – housing accounts for 42 percent of CPI but only 22.6 percent of PCE. That’s partially due to the inclusion of other costs like healthcare but also because PCE measures housing-related costs for individual homeowners differently.
The different weights mean different inflation rates, which you can check out in the chart below. You can see that the two rates are reasonably close over time, but PCE is systematically lower by approximately half a percent per year.
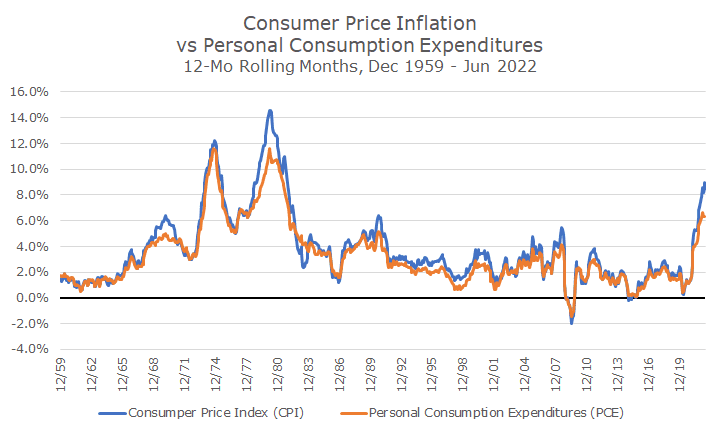
The most recent PCE data is from May and the difference between PCE and CPI is more than the average at -2.2 percent, which is uncommonly wide, making the Fed’s inflation-fighting challenge even trickier.
I’ve always read that the Fed prefers PCE, and it’s easy to understand when you realize that the PCE is all-inclusive versus just out-of-pocket for CPI. According to one BEA study I saw, CPI captures about 74 percent of what is covered in PCE.
As noted in previous articles, economists often look at inflation excluding food and energy since they are very volatile components. The folks at the BEA do the same thing with PCE, and the core PCE reading was 4.7 percent in May.
That still leaves a lot of work for the Fed. Even if food and energy prices magically fixed themselves (not likely), core PCE still needs to fall by almost 60 percent to get back to target, which is why so many interest hikes are still in the cards.
As I’ve said before, I’m glad I’m not a voting Fed member.

David is a trusted advisor to 50 families, delivering comprehensive financial solutions, including financial planning, investment management, cash management, tax planning, estate planning, and charitable giving. As Chief Investment Officer, he leads the Investment Committee and the research and trading team. His team continuously evaluates investment strategies and securities, working closely with Portfolio Managers to implement them effectively.