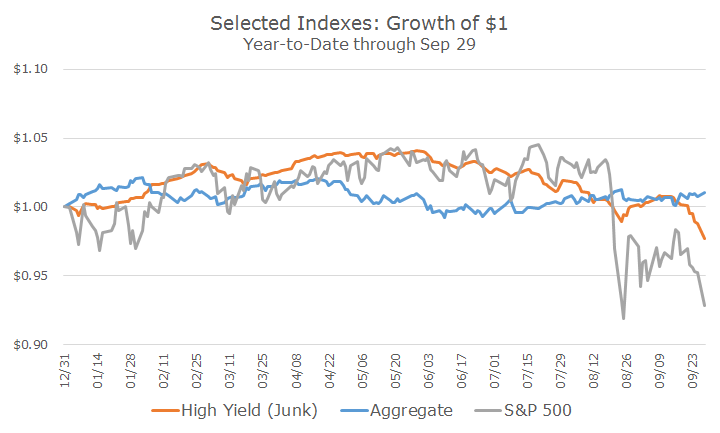
As stocks fell over the past several weeks, the junk bond market has also sold off as seen in the chart below. The orange line follows the Barclays High Yield, or junk, bond index and you can see how it has roughly tracked the S&P 500 this year.
Some commentators have argued that junk bonds served as a bit of a ‘canary in the coal mine’ because they dropped off a little bit in July while stocks held steady, but I’m not sure it’s anything more than market noise.
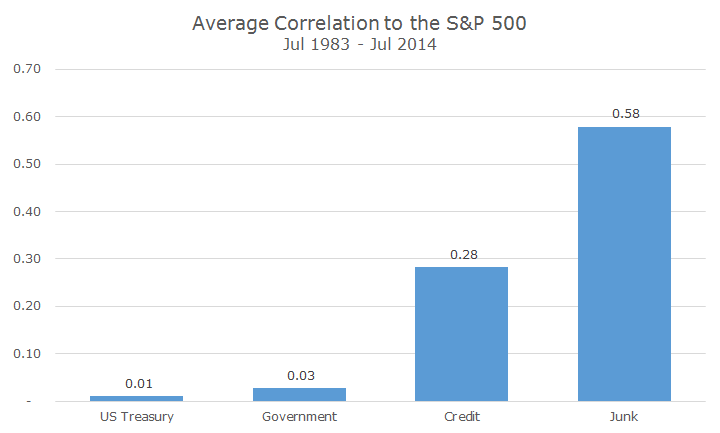
It’s well known that junk bonds are highly correlated with stocks, as I wrote last September in an article titled, ‘Why We Avoid Junk Bonds.’
In that article, I said that the long-term correlation between the S&P 500 and the Barclays High Yield index was 0.58. I’ve inserted the same chart and haven’t updated the data, but given what we are seeing this year, I suspect things haven’t changed much.
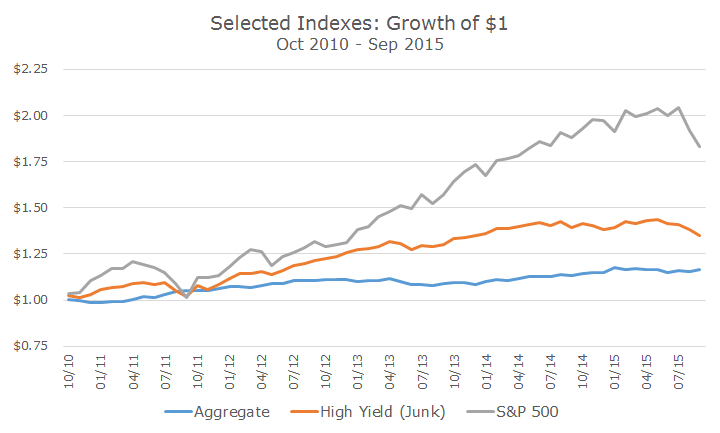
We don’t invest in junk bonds partially because of the high correlation, but you could make the argument that it deserves a place in a portfolio. The chart below shows how junk bonds have fared versus the S&P 500 and the bond market as measured by the Barclays Aggregate, and it’s been fine.
We often describe junk bonds (and similar sectors like convertible bonds, preferred stock and emerging market bonds) as ‘stocks-light.’ They track stocks, albeit with less risk and less volatility.
A proponent of junk bonds would agree and say that they just happen to be between stocks and bonds on both the risk and reward spectrum, which is true (and even visible in the simple chart below that shows the returns over the past five years).
Our view is that junk bond aren’t inherently bad, they just happen to go through bad times at the same time that stocks do. We think that investors are worried enough about their stocks during volatile periods or decline markets and there’s no reason to worry about the bond portfolio at the same time.
This is true of all corporate bonds actually, but much less so when the bonds are investment grade. For example, the Barclays US Credit index is only down -0.21 percent this year, compared to -3.15 percent for the Barclays VLI High Yield index (VLI stands for Very Liquid Index).
In a sense, nothing has changed since my article last year. Back then, it was based on historical data and everything was looking dandy in the junk bond market. I thought it would be useful to revisit the subject when it was less abstract and more real life.
Fortunately for us, we don’t own junk bonds and are avoiding the pain, so it’s still a little academic, which is fine by me.
