While I think it’s far too early to say that the correction is over, the sharp rallies over the past two days are welcome signals that suggest the forced selling that characterized last week’s sharp daily losses may be over.
My view of the recent market selloff has two components. First, as I outlined on last Monday, February 5th (click here for the article), I believe that the initial cause of the selloff was concerns about rising bonds yields, which are, in turn, based on inflation concerns.
That explains the losses through the Friday before, but what happened after my article was published can’t be explained by rising bond yields.
For context, the yield on the 10-year Treasury was 2.41 percent at the end of the 2017. In the days leading up to my article, the yield had jumped to 2.84 percent. While it dipped down to 2.71 last Monday when the stock market was at it worst, it drifted back up to 2.86 yesterday – right back where it was before the major part of the stock selloff.
So if the selloff last week can’t be explained by a jump in bond yields, what could it have been?
Of course, after-the-fact narratives like this often prove inaccurate later when even more facts are revealed. I think that leveraged traders using volatility based strategies were forced to sell stocks at any price to get their leverage back down to acceptable levels.
What the heck does that mean? Well, the first thing to know is that a lot of traders use volatility in a way that we don’t. For us, volatility is a just a measurement of stock movements. We don’t attempt to manage it in any way as it moves around (to see the volatility of volatility, click here for an article that I wrote in 2016).
Other traders attempt to harness volatility in different ways. For example, traders target portfolio volatility so that when volatility is high, they lower their stock exposure. Conversely, when volatility is low, as it was last year, they leverage their stock exposure.
Many traders believe that volatility can be reasonably forecast because it exhibits what is called ‘autocorrelation,’ which means that what happens tomorrow (or some future time period) is somewhat connected to what happened yesterday and today (Lazard wrote a nice, detailed piece on this in 2015, which can be found here).
What happened last week was very unusual in that expected volatility, as measured by the CBOE Volatility Index (or VIX), jumped more than it has in its history (albeit, it’s a relatively short history dating back to 1993).
In fact, the VIX spiked far, far more than you would have expected based on the stock market action. The following chart shows the daily change in the VIX in the y-axis compared to the daily change in the S&P 500 on the x-axis.
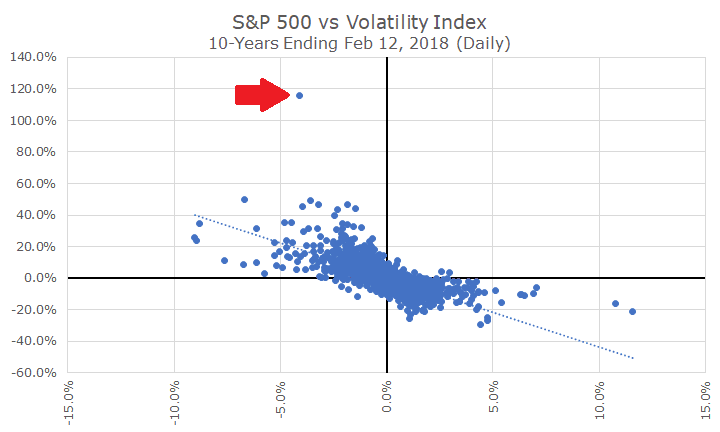
What you can see is that, in general, the changes between the VIX and the market are negatively correlated. In general, when stock prices are rising, the VIX is falling (the bottom right quadrant). And, in general, the opposite is true, when stock prices are falling, the VIX is rising (the top left quadrant).
The blue dot next to the red arrow above shows what happened last Monday. You can see that when stocks fell, the VIX rose, like you would normally expect. However, you can also see that the magnitude of change was way, way, way out of the ordinary.
For that kind of move in stocks, you might expect the VIX to jump between 10 and 50 percent – not 120 percent!
You could argue that for that jump in volatility, you could expect stocks to fall 20-25 percent, but that didn’t even come close to happening. I happen to think that ‘the price is right,’ not the level of expected volatility, which is sort of a theoretical concept anyway.
If you use a model that incorporates expected volatility and you see it shooting up at insane levels, you have to start liquidating your portfolio to bring your volatility down. If your portfolio is leveraged, you may be forced into selling stocks by your broker at any price to meet house or regulatory requirements.
Other strategies, like ‘selling volatility’ and ‘risk-parity’ have been blamed as well. I think it’s hard to say which one of these strategies (if any of them) forced people to sell; but rest assured, that your money wasn’t invested in any of them.
One of my favorite Wall Street impresarios, Cliff Asness of AQR Capital, was all over the media (like here and here) saying that risk parity isn’t to blame. He may be right, I don’t really know, but I do think that the chart above tells a compelling story that undoubtedly impacted a lot of strategies.
It’s my opinion that the forced leverage-related selling is over. But, as I noted at the top, that doesn’t mean that we’re out of the woods. There are two big picture issues that are concerning.
First, as I’ve been saying for three years now, I think that stocks are overvalued. They’ve also gone up a lot since I said that and they could remain overvalued for a long time (measured in years).
Second, the Federal Reserve is beginning to tighten monetary policy: the Fed Funds rate is above zero, Fed members are talking about multiple hikes this year and their bond portfolio is running off. Part of the reason that stocks trade at high valuations is that interest rates are low (there is a debate there, but I’m running long already).
I don’t think that either of these spell disaster, but I do think they are headwinds. The stock market has shrugged off both issues for years and may continue.
My worry is that sentiment shifts because of the recent selloff. That didn’t happen two years ago when we had two back-to-back corrections and it may not this time. I am bothered, though, by the insistent and incessant use of the change in Dow points to describe the market.
I think it scares people to hear that the Dow is off 1,000 points in a single day. People should realize that losing 1,000 points today with the Dow at 24,600 is a lot different than it was 10 years ago when the Dow was 8,700.
Sadly, most people don’t think about the denominator with the Dow and realize that 1,000 points today is 4.1 percent on 24,600, as compared to 11.5 percent on 8,700.
Of course, I don’t know what is going to happen next – nobody does.
In the words of famed investor Howard Marks of Oaktree Capital, you can’t predict, but you can prepare.
I wasn’t as pithy as Mr. Marks, but I do think it makes sense to remember your time horizon, put the losses in context, remember that your investments are boring and don’t involve leverage, volatility targeting or other funky stuff like that, and, most importantly: we’ve planned for this.
As I talked to clients last week, I was impressed how everyone is taking the correction in stride. That’s exactly the right attitude; but, of course, if you have any questions or concerns, give us a ring.
