While Greece is getting all of the headlines, the bubble in mainland Chinese stocks that I wrote about in April and June is now bursting (click here or here for refreshers). The Shenzhen index is down -38.5 percent from its peak on June 12th through yesterday and the Shanghai index is down -27.9 percent over the same time period.
The following shows these two indexes in yellow and orange compared to the S&P 500 in blue and the MSCI EAFE EM index of emerging markets stocks. I chose a three year time horizon just to show that the two Chinese indexes really weren’t doing much of anything until last summer when they really took off.
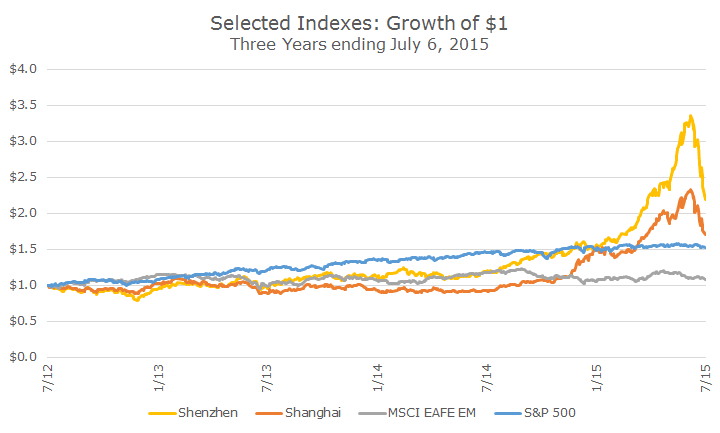
Part of what I find amazing about this chart is that the S&P 500 is up roughly 50 percent during that time frame, but the growth of a dollar in the chart looks nearly flat compared to what happened in mainland China shares.
I also think it’s interesting to note that both the bubble and the burst haven’t had much effect on the MSCI emerging market index, which is nearly flat over the past five years. You can see a little bit of a downturn recently, but Greece is also a factor.
The theory that a bursting bubble in mainland China stocks wouldn’t have much impact on the rest of the world has played out so far, although you never know what the next turn will be. The idea of relative containment is based on the fact that mainland Chinese stocks are largely restricted from outside investment.
In June, two days before the mainland Chinese stock markets peaked, Vanguard announced that it had been provided an allocation to buy mainland Chinese stocks. While I was happy to have exposure to the second largest stock market in the world, I was really bummed out by the timing.
When our Vanguard reps called to give us the news (which we had already written about), I chided them for their bad timing, which, at this point, doesn’t look so bad anymore (click here for a refresher).
While we don’t know much about Vanguard’s time table, we can say that the largest competing index fund, which won’t be adding mainland Chinese stocks, isn’t performing as well as Vanguard’s emerging markets fund, so we can say with confidence that Vanguard didn’t get very far in their purchases.
You may be looking at the largely flat emerging markets returns in that chart, feeling nervous about Greece and China and wondering whether you should have emerging markets exposure at all. I completely understand the question and have two answers that I’ll bet you can anticipate.
First, having two assets that you expect to earn positive rates of return over long periods that don’t move in lockstep with each other is a huge benefit to a portfolio – it’s the basis for diversification. If all assets were correlated with each other, you couldn’t lower portfolio risk by having the two assets.
Second, the valuations overseas are much more attractive than they are in the US (and if you put a positive spin on the recent declines, you can say that they are getting more attractive every day).
One of the better (though highly imperfect) measures of valuation is the Shiller PE ratio, which looks at current prices compared to 10 years of earnings to remove some of the volatility in the ‘e’ part of the ratio.
The PE-ratio of the S&P 500 is currently around 26, which historically is very expensive. I wrote in February of 2014 that the market was overvalued on this basis and it’s more true today than it was then (which is why you don’t make big moves based on the Shiller PE ratio).
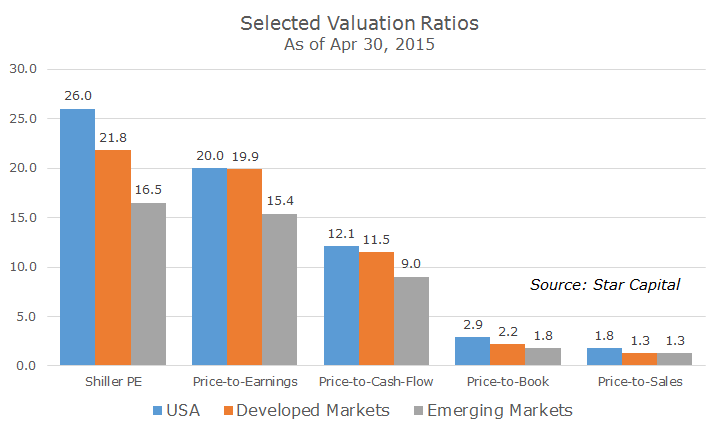
Whether you look at the Shiller PE or several other valuation metrics, you can see that emerging markets are the cheapest across the board. That doesn’t tell us anything about returns in the short run, but if the future is like the past, it should tell a lot about long-term future returns.
