Last week, the phrase ‘inverted yield curve’ exploded from the confines of a trading room to the everyday world.
It hit me when I went to a holiday cocktail party after work one night and someone said, ‘oh, I heard that the stock market is down because something else is upside down. I guess the whole world is upside down!’
Before we get into what happened last week, let’s take a quick look at a normal yield curve and an inverted yield curve.
The left image below sums up the normal, upward sloping yield curve. The term of the bond, or when it matures, is on the x-axis. In a normal environment, the further out the in the future, the higher the yield, on the y-axis.
Under normal circumstances, yields are higher the further out you look into the future because there is more uncertainty, which requires a higher yield for taking the risk associated with the uncertainty.
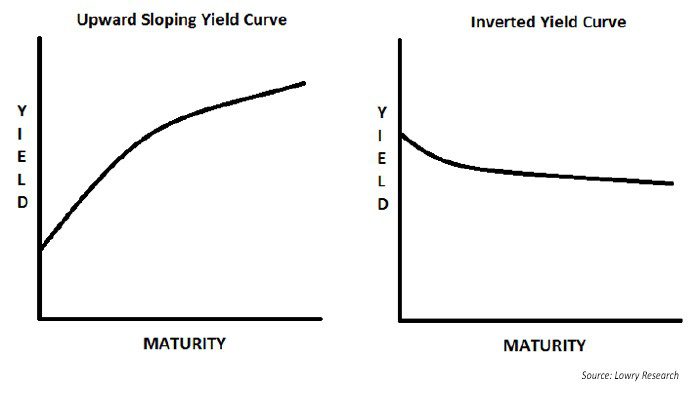
On the right side, you can see an inverted curve, where shorter-term yields are higher than longer term yields.
The curve inverts for a few reasons, and none of them are great. The curve could invert, for example, if investors believe that economic growth will slow causing the Federal Reserve to cut short-term interest rates or if the market expects very low inflation or deflation.
Economists and investors are particularly mindful of the shape of the yield curve because since 1970, an inverted curve has foretold a recession. The image below is from the St. Louis Federal Reserve FRED database, and it illustrates the concern about the inverted yield curve and recessions.
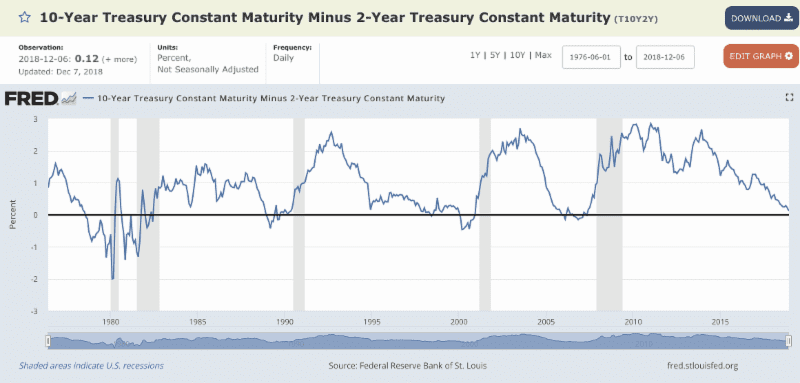
If you can’t see the image well, you can see it on their website by clicking here.
The chart shows the difference in yield between the 10-year Treasury and the two-year Treasury in blue over time. At some points, the differences are very wide, more than two percentage points.
At other points, however, the difference dips below zero, which is indicated by the dark line running through the center of the image. Importantly, when you look at the when the spread goes negative, a recession (indicated by the gray bar) tends to follow in relatively short order.
Let’s look for a moment a today’s yield curve now. In addition to the curve from Friday, in orange, I included the curve from the first day of the year, in blue.

The bottom curve, in blue, from the start of the year looks pretty normal. The curve from today, is funny looking, but it’s not inverted. Past one year, it’s pretty darn flat, but there is a tiny little bow at the five-year that is below the two and the three year, and that’s what the market is so worked up about.
I have to admit that I am a little annoyed by the financial press who keeps talking about the curve inverting as if the whole thing is inverted. Remember that chart above from the Federal Reserve that shows the 10-year minus the two-year? If that goes negative, then I’ll agree that the curve is inverted.
I guess, though, in fairness to the media, the difference between two’s and ten’s is very small, only 0.14 percent. It wouldn’t take a ton to invert the curve from here, and that’s the true concern.
I still want to point out, though, that an inverted curve doesn’t mean that a recession will follow automatically tomorrow. At the very least, you can see from the Fed image above that the inversion precedes the recessions by months, sometimes more than a year.
There is also some research that shows that an inverted curve may mean something different when rates overall are very low. It does seem logical to me that we should infer something different from an inversion when rates are at two percent, instead of say, six or eight percent.
That said, I do think that investors should be cautious. The bond market is telling us something about their expectations about inflation and growth, and last week, the stock market was clearly listening.

David is a trusted advisor to 50 families, delivering comprehensive financial solutions, including financial planning, investment management, cash management, tax planning, estate planning, and charitable giving. As Chief Investment Officer, he leads the Investment Committee and the research and trading team. His team continuously evaluates investment strategies and securities, working closely with Portfolio Managers to implement them effectively.