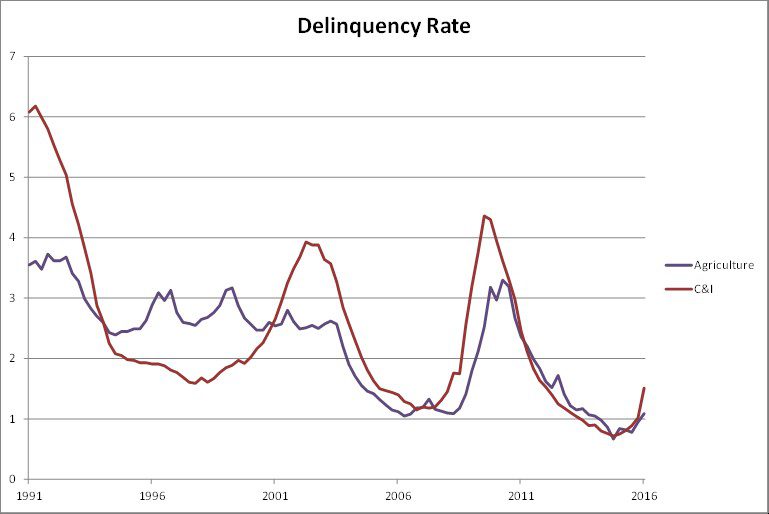
“Businesses are Falling Behind on Their Loans Like it’s 2008.” This is a headline that popped up on my Bloomberg TOP news screen recently. Since the financial crisis, every bank I have talked to has been focused on increasing C&I lending. After being snake bit by real estate, banks have all chased after commercial loans. That makes a headline like this particularly alarming and a situation worth further investigation.
Looking at the actual data from the Federal Reserve, one can clearly see that indeed, delinquency rates on C&I loans and Agricultural loans have increased at a fairly steep rate. The rate is nowhere close to where delinquencies reached in 2008, but the trend is still disturbing.
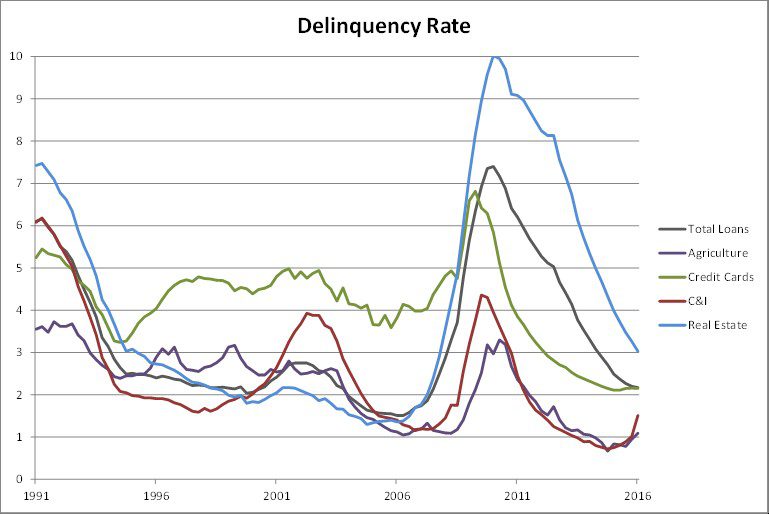
If C&I and Ag loan delinquencies are on the rise, how does that compare to credit in other sectors of lending? The good news is that delinquencies on average are still declining. The graph below shows delinquency rates for other sectors such as Real Estate (blue) and Credit Cards (green) as well as the average across all loans (black). Rising delinquencies, thus far, are fairly contained to just certain sectors. But… that was true in 2008 too. Looking at that graph, one can see that Real Estate delinquencies spiked over a year before any other sector was effected. The deterioration in Real Estate loans eventually spilled over to the entire economy.
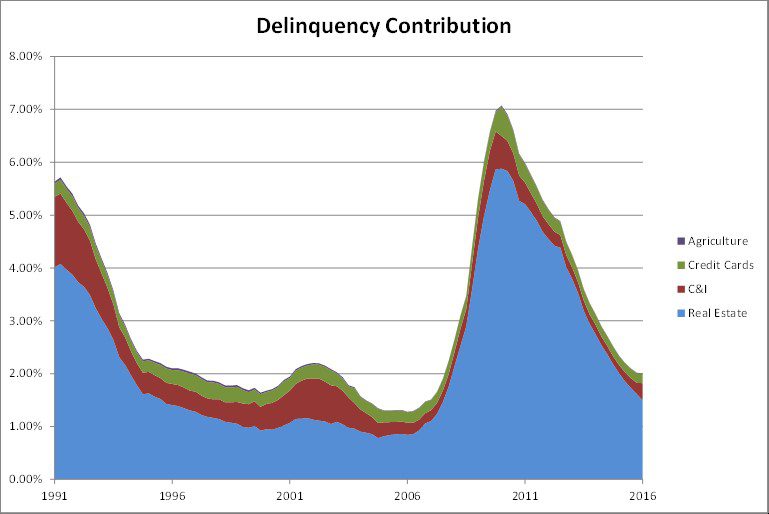
We must remember, though, that not all lending sectors are created equal. Real Estate makes up about 50% of Total Loans vs only 20% for C&I lending. This next chart tracks the delinquency rate for all loans in the banking system and illustrates the contribution of each sector. That massive blue area is the contribution of delinquencies in Real Estate, where the much thinner red line is the contribution of C&I loans to total delinquencies. This graph illustrates how C&I delinquencies, while rising, are not a threat to destroy the capital of the US banking system the way that Real Estate took down the financial sector and the economy in 2008. C&I is significant, but the increase in problem credits system-wide has little effect thus far as the performance of Real Estate loans will continue to dominate overall credit quality due to the overwhelming size of the industry.
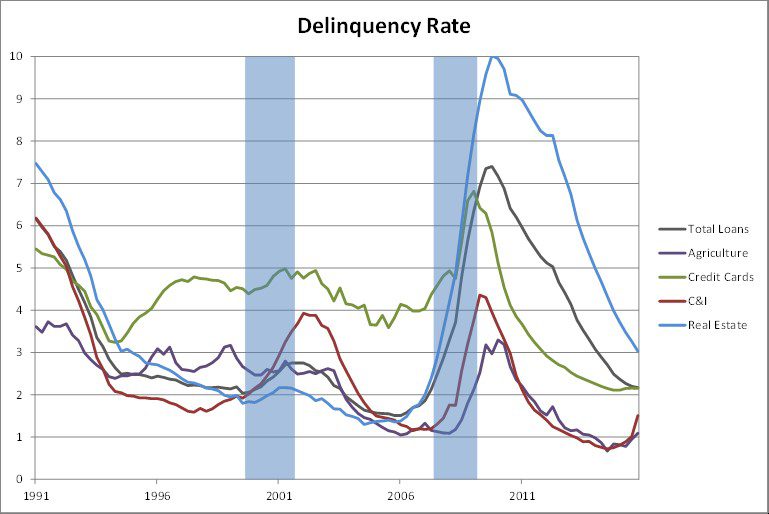
However, just because it is small, we cannot just ignore this change in momentum for C&I credit. Looking back at the graph for delinquency rates across sectors, but this time overlaying the past few recessionary periods, one can see that C&I delinquencies have only spiked during a recession. This data only goes back to 1991. The high delinquency rates in 1991 coincide with the 1990-1991 recession, it just does not plot well on this graph. Therefore, the last three times C&I credit has performed poorly as it is today coincided with a deteriorating macroeconomic environment in the US.
This indicator alone does not spell economic doom, but when combined with lackluster GDP growth this year and negative momentum in employment, it does cast some doubt on the strength of the current economy. The good news is that, from a total loan standpoint, this does not look like a replay of 2008 as the headline suggested. The bad news is that if recent history repeats itself, this could be a harbinger of difficult economic times ahead that could cause interest rates to stay lower for longer. Like everything in this economy, it’s a mixed bag.
Sources: Bloomberg, Federal Reserve, FDIC