Let’s talk about the week that was, as the S&P 500 fell -7.03 percent, on top of the losses of 5.71 percent over the previous two weeks. All told, the loss for the S&P 500 is now -17.54 percent from the all-time high set on September 20th.
Although I don’t follow the Dow Jones Industrial Average (DJIA) closely, I know that many of you do, in part because that’s what’s reported on TV and on the radio.
Last week, the DJIA fell -6.87 percent, on top of the -5.63 percent drop over the previous two weeks and is now -16.33 percent below its all-time high, set on October 3rd.
Amidst these losses, I think that it makes sense to widen our gaze from the strict selloff to the calendar year, which is my favorite measuring period.
From this vantage point, the losses are a lot less alarming, with the S&P 500 and the DJIA falling -7.88 and -7.13 percent respective. Not great, to be sure, but not radically bad either.
During a correction in 2015, I posted an article and chart that showed the calendar year return for the past 25 years along with the largest peak-to-trough loss in that year.
I’ve updated the chart though Friday, and even though I cut off the first three years, it looks pretty much the same.
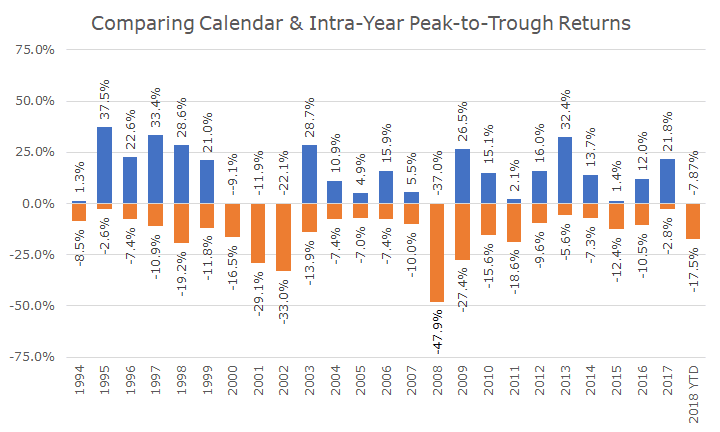
I looked at the average intra-year drawdown, and it was -13.4 percent, which made me feel a little better about the current -17.5 percent drawdown.
Then, I decided to remove the drawdowns that occurred in the tech wreck of the early 2000s and the 2008 financial crisis, and the average drawdown excluding the down years is -10.1 percent, which I think highlights the seriousness of the current drawdown.
The tougher question, and the one that I don’t have the answer for, is where things go from here.
It’s easy to make the bearish case that stocks will fall further since valuations are still relatively high, the Fed and the market are still out of sync, growth is slowing globally, and sentiment is clearly sour.
The bullish cash never seems rational in the midst of a selloff, but it’s very possible that markets are over-shooting to the downside since the economic fundamentals are still intact.
The Atlanta GDP Now Forecast expects that the economy will grow by 2.7 percent (real) in the fourth quarter. While that’s lower than it was six months ago, it’s still a little better than a year ago, when the realized level of GDP was 2.5 percent.
As I’m sure you’re aware, I don’t know where the market is headed next, which is one of the reasons why we, as a firm, rely on strategies and models to get us through the inevitable tough times.
Most importantly, our financial plans anticipate this kind of market, and factors them into the assumptions that we use when estimating the odds that you’ll meet your financial goals.
If anything, the last 10 years of gains were more of an outlier than the last few months, and we can all be thankful for that.
In my article from 2015, here’s how I concluded:
It’s easy to get swept up in the media frenzy when things are sour, and like like what one of my clients did when he turned on the TV and saw what was happening: he turned it right off and went bank to his daily business. We’ll take care of the rebalancing and tax loss harvesting, if appropriate, and you can take a walk and enjoy the unseasonably cool August that we’re having.
I stand by that advice today, although rather than enjoy a walk in the cool weather, I hope that you have a very Merry Christmas! Or, just as good, a great day off and some delicious Chinese food! Either way, be well, enjoy the day off and don’t think about the market.

David is a trusted advisor to 50 families, delivering comprehensive financial solutions, including financial planning, investment management, cash management, tax planning, estate planning, and charitable giving. As Chief Investment Officer, he leads the Investment Committee and the research and trading team. His team continuously evaluates investment strategies and securities, working closely with Portfolio Managers to implement them effectively.