A few weeks ago, I wrote that even though stock prices were still volatile, the stress in the market was settling down; I called it ‘stabilizing, but turbulent.’
Financial journalists often write about the ‘market plumbing,’ and it occurred to me that plumbing is a good analogy for the difference between stress and turbulence. Volatility is like being in a nice hot shower and it turns ice cold.
Obviously, something’s wrong, but water is flowing through the pipes rather than spraying out into your basement. That’s more like market stress – the pipes are broken and it’s creating a bigger problem elsewhere.
During the most acute phase of this crisis, I was as concerned about the pipes breaking as I was the temperature of the water, even though that was pretty upsetting too.
In my earlier article, I looked at two stress markers, the CBOE Volatility Index (VIX) and the Bloomberg Financial Conditions Index. You can see the write up by clicking here, and today, I simply want to update you on the status of those two indexes.
First up is the VIX index along with my estimate for realized volatility. I say ‘estimated’ because the finance PhDs would scoff at my simplicity – I took 21 days data and annualized it, without the clever half-lives or exponential stuff that they love. K for Close.

I showed three years of data just to show what normal times look like – pretty flat with a few spikes here and there. Those spikes don’t look like much with the corona-spike in there, but they are stressful periods.
Anything over 20 percent is hard to live with for investors, so to jump to 75-100 percent tells you why this one was so scary.
The good news, though, is how rapidly realized and expected volatility are dropping off. Yes, they’re still very elevated and they could switch directions at any moment, but the water is flowing out as quickly as it flowed in.
I doubt we’ll see average levels anytime soon, but we’re moving in the right direction.
The same is true for the Bloomberg Financial Conditions Index, shown here:
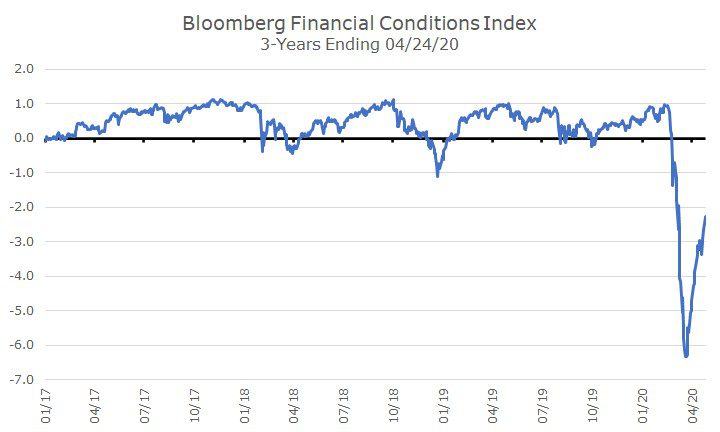
This index combines a lot of information about money markets, bond levels and spreads, stock prices and volatility and ‘normalizes’ them. When nothing is happening, you get a reading between zero and one. When the index falls below zero, it means that there is some stress in the system.
The numbers of the x-axis are standard deviations, which means that two-thirds of the time, the data should fall between -1 and 1. Ninety-five percent of the time, it should fall between -2 and 2.
A reading of -6 ought to occur every 1,167 years by my calculations, which is a pretty bad sign. You’d like to think that since modern markets are only 90 years old that it will be a long time before that happens again, more than 1,000 years maybe.
But like the floods that we see breach 500-year levees more than once, it’s only been a dozen years since we saw a reading this bad for the Bloomberg index; back in 2008.
Like the VIX index, though, the good news here is that despite the massive stress, we’re almost back to semi-normal and things are headed in the right direction.
I don’t think it’s a stretch to say that both of these indexes reflect the massive monetary and fiscal stimulus that the government has produced so far.
As usual, the next question will be how data from the real economy come in and see whether it’s better or worse than current expectations.
Remember, though, that even if the data comes in worse than expectations, markets can go lower without nearly as much stress on the system. Like the ice cold shower – very uncomfortable, but the water’s still on.