As regular readers of this letter know, we are not big believers in forecasts. We believe that forecasting future economic and market conditions is about as reliable as a long-term weather forecast in St Louis. However, many relationships have a history of moving together. When one changes, it can often be wise to take notice. The strongest of these indicators has been the Yield Curve.

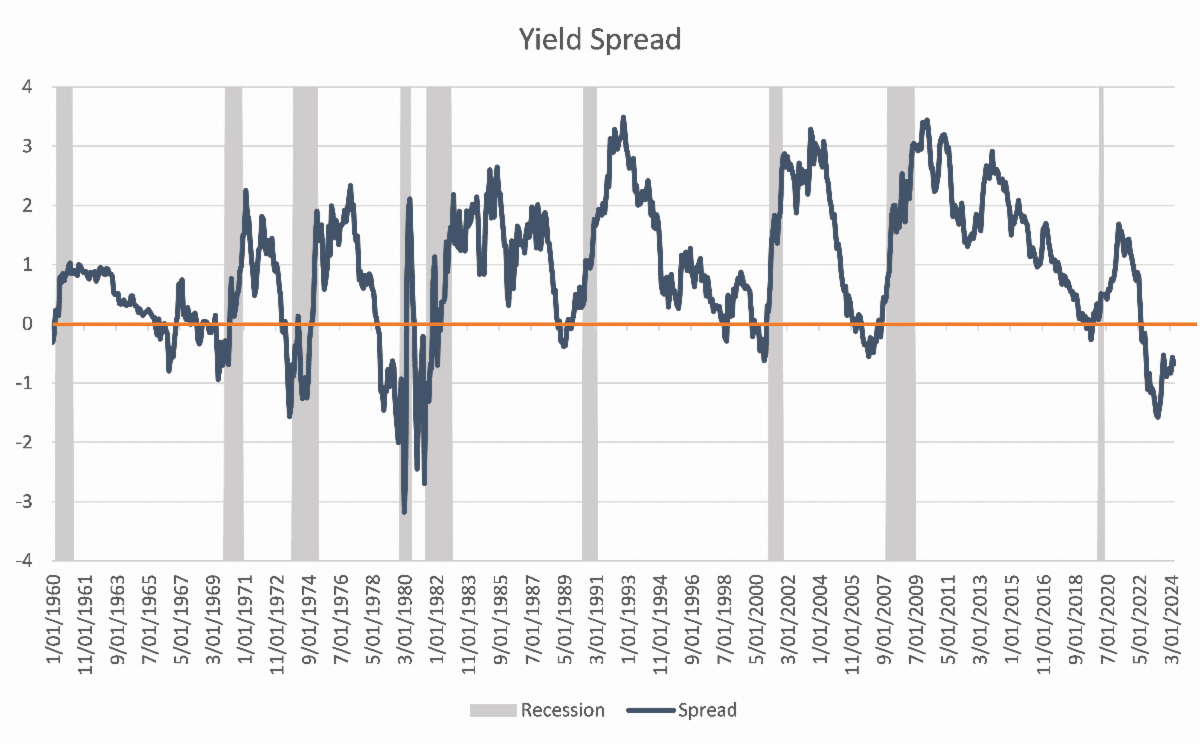
The Yield Curve refers to the market yields on US Treasury bonds for every maturity that is available– from overnight to 30 years. Considered to be the “risk-free rate”, these rates make up the bedrock of the global financial system and serve as a benchmark for lending markets. Typically, the curve is upward sloping, with long-term yields higher than short-term yields. There is more uncertainty and risk in lending money for longer periods, so longer bonds should have a higher yield.
However, sometimes short-term yields are higher than long-term yields. This is what is called an Inverted Yield Curve. In the post-war period, an inverted yield curve has preceded the past nine recessions with uncanny timeliness. Only once, has the yield curve inverted and a recession not followed shortly thereafter.
There are economic arguments for why this relationship is strong and why an inverted yield curve would predict an economic slowdown. When investors accept a lower yield for a longer bond, it shows that the market expects rates to fall in the future. Often, this is because the market expects the Fed to cut short-term rates to boost a falling economy.
In addition to showing the market’s forecast, an inverted yield curve can often be self-fulfilling. Higher rates on short-term bonds can pull more cash into shorter, safer investments, leaving less money available to fund longer-term investments. Banks are less profitable as they make less spread from taking in short deposits and lending longer loans. All of this leads to a contraction (or at least slower growth) in the money supply and tighter monetary conditions.
For all of these reasons, there has been much ink spilled about a coming recession since the yield curve became inverted in July 2022. Yet, nearly two years later, the economy remains strong and employment remains tight.
The yield curve has now been inverted for a record 400 trading days without a recession, leading some to question if it is still a reliable predictor. There are cracks forming in the economy which could see a recession appear quickly. Or, the massive fiscal impulse seen since the pandemic and now AI spending could continue to keep this buoyant economy afloat. Only time will tell.
While we may question if the yield curve remains a reliable recession indicator, we remain confident that it can tell us something about markets. Shorter bonds are safer than longer bonds, which is why shorter bonds typically have a lower yield. In this environment, investors can get a higher yield with less risk by investing in shorter bonds. Therefore, it makes sense to overweight the portfolio to shorter bonds right now as that part of the market provides a much better risk/return profile.
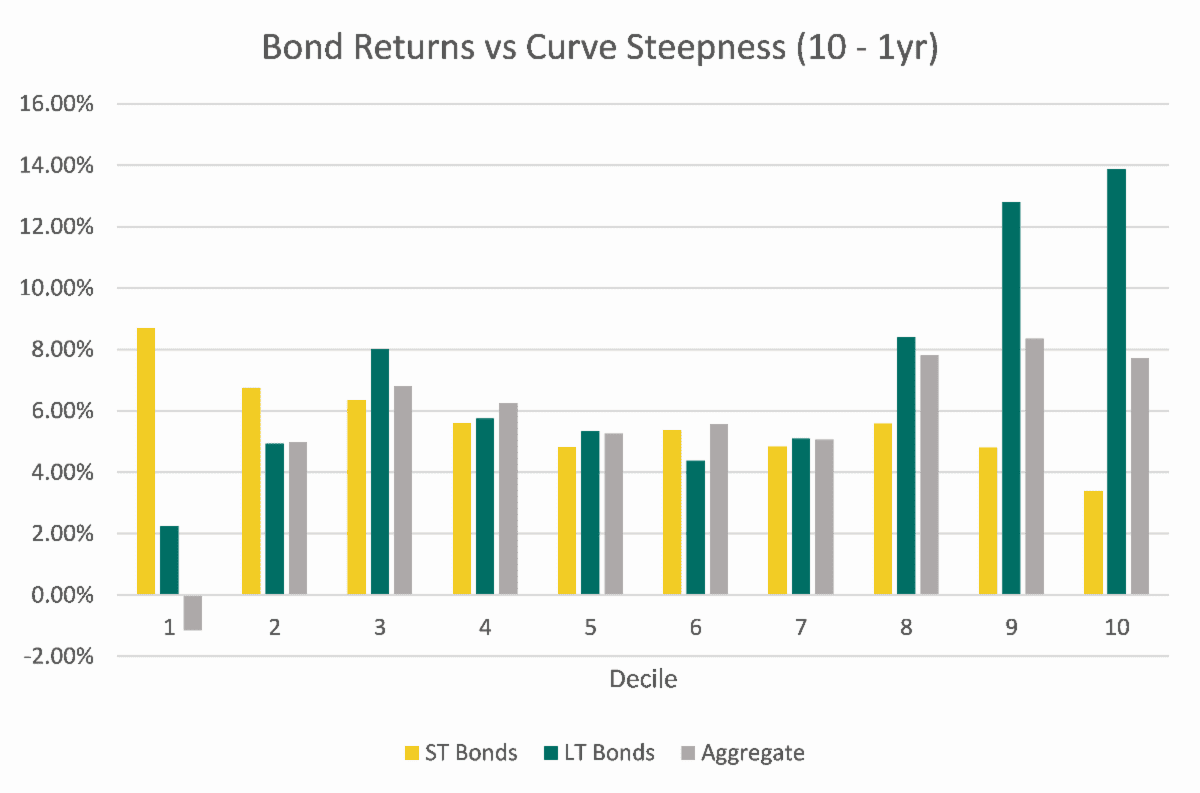
This chart tracks the trailing 12mo return of an index of short-term bonds, long-term bonds, and the Aggregate index. These returns are divided into buckets based on the steepness of the yield curve. There is compelling evidence that short-term bonds and long-term bonds perform differently when the yield curve is at extreme levels.
Today’s yield curve is squarely in decile 1, indicating that short-term bonds are likely to outperform long-term bonds in the near term. Therefore, investors may want to overweight their bond investments towards shorter-term bonds to capture this higher yield with less risk. However, we still want to hold some longer bonds. Holding longer bonds can lock in today’s relatively high yields and will benefit the portfolio if rates fall. Longer-term bonds also offer a better hedge against equities and therefore remain appropriate in a balanced portfolio.
The yield curve has had a stellar track record as an economic indicator. Despite this time potentially being different, there is still valuable information we can glean from it. While we have yet to have a recession this time, it is not yet time to count it out. Like the weather in St Louis, things could change rather quickly.