After a summer of historically low and realized volatility in the market, we finally saw a sharp spike in volatility as tensions rose between North Korea and the US last week. While the exact cause and timing behind the volatility could not have been predicted, we did know that the low levels of volatility would not continue forever. Whether or not volatility is back for a while, it is always good to be informed to the inner workings of your portfolio.
Last October, Dave wrote a great article discussing the decomposition of risk in your portfolio. In short, he illustrated how even in a “balanced” 50-50 portfolio, the equity portion of the portfolio dominates the volatility in the portfolio, with about 92 percent of the portfolio’s volatility being driven by the equity portion.
I took his work a step further and looked at the decomposition of risk across multiple asset classes. Using different indices to create a strictly hypothetical portfolio, I was able to break equity into four parts and fixed income into three parts. From there, we can see similar results to Dave’s previous work, but seeing the attribution can help deepen our understanding of how our portfolios operate.
In order to properly assess the contribution to risk, I used a rolling 24-month period going back to 1990 for multiple common indices. The break-down of the weights and volatility for a hypothetical 50 percent equity and 50 percent fixed income portfolio are below:
| Asset Class | Percent Allocation | Annualized Volatility |
| US Large Cap | 30% | 14.24% |
| US Small Cap | 8% | 18.74% |
| Developed International | 10% | 16.77% |
| Emerging Markets | 2% | 22.77% |
| US Bond Aggregate | 40% | 3.61% |
| Global Bond Aggregate | 7% | 8.33% |
| Cash (3-Mo Treasury) | 3% | 0.71% |
Using these allocations, total returns for the indices from Bloomberg, as well as the correlations among the indices, I was able calculate the asset class attribution to risk which is shown in the stacked graph below:
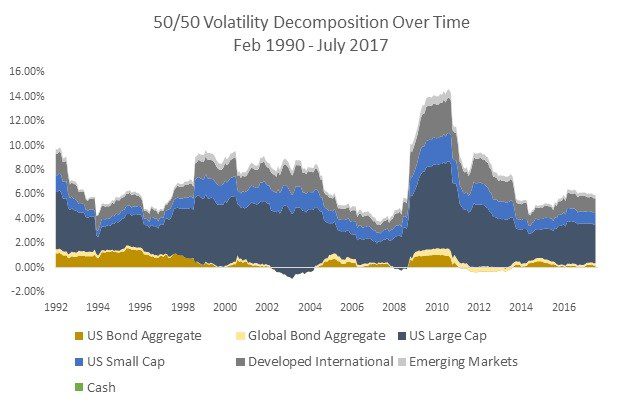
With an annualized portfolio volatility of 7.71 percent over the last 27 years, we can see how we have been in a relatively low and stable period of volatility over the last five or so years. This doesn’t mean we should panic, but rather we should not be surprised when volatility does return.
It is also worth noting that implied volatility is not realized volatility. In weeks prior, one of the recurring topics in the news has been that the CBOE Volatility Index was at historical lows (see Dave’s article on the subject here). While this is true, just looking at the chart above, we can see that over a two year rolling period, the volatility in a 50/50 portfolio is still higher than it would have been back in the early/mid 2000’s. In other words, implied volatility was at record lows, but actual volatility (in a hypothetical portfolio) was still higher than pre-crisis levels.
Looking at the chart, we can also see the similarity to Dave’s simple 50/50 portfolio where he just used the S&P 500 and the Barclays Aggregate Index. With just those two asset classes, the annualized portfolio volatility was 7.51, a 20 basis point (bps) difference from our more diversified portfolio.
This is primarily due to the high levels of correlation within the equity asset class. For example, over the given time period, the correlation between US large cap and developed international was 0.76. This means that changing the allocation weight of those individual asset classes would have had a minimal effect on overall portfolio volatility, because they were so highly correlated.
This doesn’t mean that the diversification among asset classes is useless; but rather when it comes to volatility in the portfolio, the allocation among the equity allocation is less significant than the overall allocation to equity and fixed income.
However, the diversification can make a significant impact on the returns side. Creating and comparing three hypothetical 50/50 portfolios, where one is our diversified portfolio from above, one is Dave’s US stock/bond split, and the third is an international stock/bond split, we can easily see the benefits on the returns side, while only adding 20 bps annually of volatility!
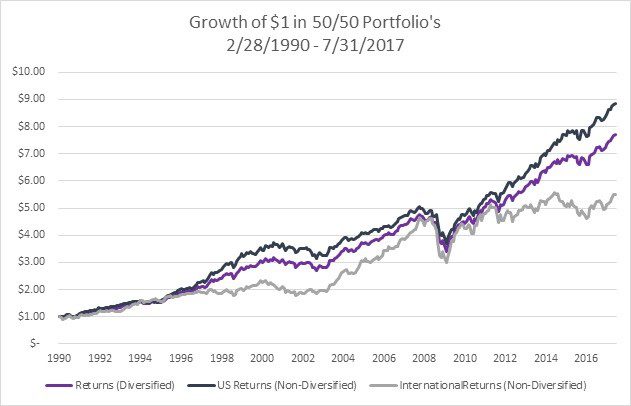
Now looking at that chart, it may seem like adding the diversification is counterproductive as it adds higher volatility and lower returns. But it is important to note that this is only a conclusion we can draw after the fact. Going forward, we don’t know which asset class will be the best performer. In this case, over the last 27 years, it would have been large cap US stocks. But the next 27 years could produce something completely different; thus we diversify to make sure we capture the return without being fully exposed to one asset class bet.
Finally, I wanted to look at the actual percentage contribution from each asset class over time. If you look at the chart below that shows the rolling percentage of risk contribution in a diversified 50/50 portfolio, you can see how the equities for the most part stay within a small range and move similarly to the other equity asset classes. Meanwhile bonds tend to have little correlation with equities and actually, during some time periods, provide “negative” volatility to the portfolio, which just means that because of the correlation to other asset classes, it brings the overall portfolio volatility down.
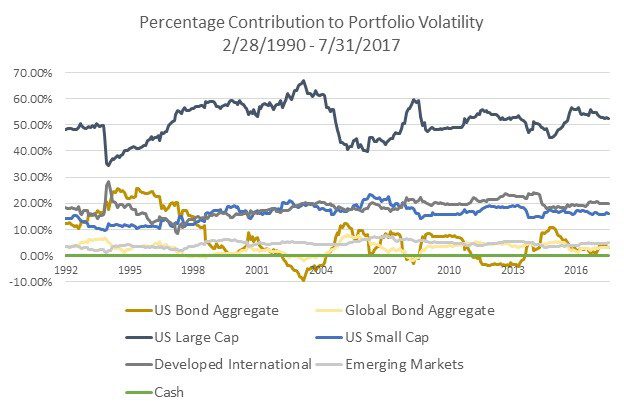
Looking at the chart, you can see the diversification working in periods like the mid-90’s when volatility contribution from US large cap dropped and contribution to international volatility rose. This is why we do spend time analyzing the movements of different equity classes and determining the right mix of different equity asset classes.
While we do live in an increasingly globalized economy where a crisis in one country (think Greece) can have reverberations across the world, those effects can be mitigated through different asset classes as well as the overall allocation to equity and fixed income.
That last point is extremely critical to your portfolio and it is why we spend so much time determining the right mix of stocks and bonds for each individual. Looking at the percentage contribution chart, you can easily see the inverse relationship between stocks and bonds.
Risk and returns are never guaranteed and as illustrated (and possibly experienced) in the Growth of One Dollar Chart above, your portfolio will likely incur losses when the market falls. But with the right mix of asset classes and allocations, you can rest easy knowing that over time, your volatility should be mitigated as you continue to build your wealth.